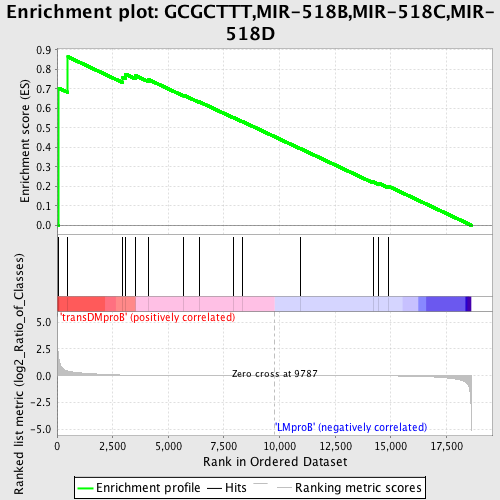
Profile of the Running ES Score & Positions of GeneSet Members on the Rank Ordered List
| Dataset | Set_04_transDMproB_versus_LMproB.phenotype_transDMproB_versus_LMproB.cls #transDMproB_versus_LMproB |
| Phenotype | phenotype_transDMproB_versus_LMproB.cls#transDMproB_versus_LMproB |
| Upregulated in class | transDMproB |
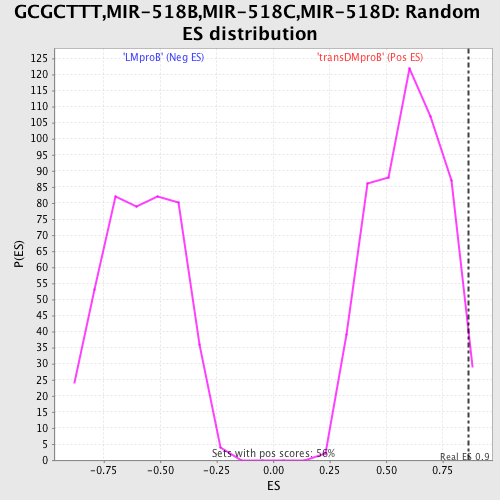
| GeneSet | GCGCTTT,MIR-518B,MIR-518C,MIR-518D |
| Enrichment Score (ES) | 0.86453736 |
| Normalized Enrichment Score (NES) | 1.4477918 |
| Nominal p-value | 0.01607143 |
| FDR q-value | 0.49691984 |
| FWER p-Value | 0.999 |
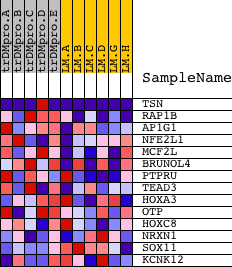
| PROBE | DESCRIPTION (from dataset) | GENE SYMBOL | GENE_TITLE | RANK IN GENE LIST | RANK METRIC SCORE | RUNNING ES | CORE ENRICHMENT | |
|---|---|---|---|---|---|---|---|---|
| 1 | TSN | 13860 3966 | 68 | 1.631 | 0.7044 | Yes | ||
| 2 | RAP1B | 10083 | 487 | 0.421 | 0.8645 | Yes | ||
| 3 | AP1G1 | 4392 | 2951 | 0.061 | 0.7586 | No | ||
| 4 | NFE2L1 | 9457 | 3072 | 0.055 | 0.7759 | No | ||
| 5 | MCF2L | 18680 5082 | 3535 | 0.038 | 0.7677 | No | ||
| 6 | BRUNOL4 | 2010 4229 | 4102 | 0.026 | 0.7484 | No | ||
| 7 | PTPRU | 15738 | 5683 | 0.011 | 0.6682 | No | ||
| 8 | TEAD3 | 23053 | 6378 | 0.008 | 0.6344 | No | ||
| 9 | HOXA3 | 9108 1075 | 7917 | 0.004 | 0.5533 | No | ||
| 10 | OTP | 21582 | 8333 | 0.003 | 0.5322 | No | ||
| 11 | HOXC8 | 4865 | 10931 | -0.002 | 0.3935 | No | ||
| 12 | NRXN1 | 1581 1575 22875 | 14207 | -0.012 | 0.2228 | No | ||
| 13 | SOX11 | 5477 | 14467 | -0.014 | 0.2150 | No | ||
| 14 | KCNK12 | 9978 | 14908 | -0.018 | 0.1993 | No |