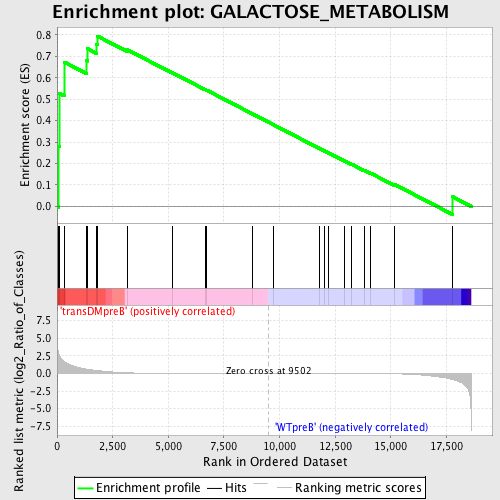
Profile of the Running ES Score & Positions of GeneSet Members on the Rank Ordered List
| Dataset | Set_04_transDMpreB_versus_WTpreB.phenotype_transDMpreB_versus_WTpreB.cls #transDMpreB_versus_WTpreB |
| Phenotype | phenotype_transDMpreB_versus_WTpreB.cls#transDMpreB_versus_WTpreB |
| Upregulated in class | transDMpreB |
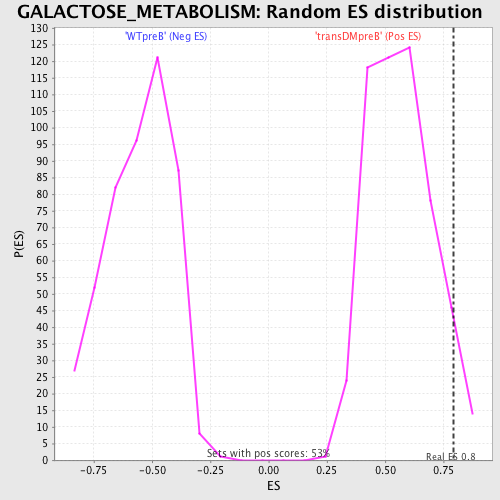
| GeneSet | GALACTOSE_METABOLISM |
| Enrichment Score (ES) | 0.79401827 |
| Normalized Enrichment Score (NES) | 1.4058813 |
| Nominal p-value | 0.051330797 |
| FDR q-value | 0.5713334 |
| FWER p-Value | 1.0 |
| PROBE | DESCRIPTION (from dataset) | GENE SYMBOL | GENE_TITLE | RANK IN GENE LIST | RANK METRIC SCORE | RUNNING ES | CORE ENRICHMENT | |
|---|---|---|---|---|---|---|---|---|
| 1 | HK2 | 17106 | 74 | 2.880 | 0.2785 | Yes | ||
| 2 | GANAB | 8992 23937 | 98 | 2.549 | 0.5273 | Yes | ||
| 3 | GALK1 | 20147 | 325 | 1.608 | 0.6729 | Yes | ||
| 4 | GALT | 16237 2399 | 1312 | 0.614 | 0.6801 | Yes | ||
| 5 | GAA | 20575 | 1356 | 0.593 | 0.7359 | Yes | ||
| 6 | GLB1 | 4443 | 1760 | 0.434 | 0.7568 | Yes | ||
| 7 | GALE | 13187 16032 | 1812 | 0.408 | 0.7940 | Yes | ||
| 8 | PGM3 | 19045 | 3153 | 0.088 | 0.7306 | No | ||
| 9 | PFKM | 5243 9554 | 5164 | 0.017 | 0.6241 | No | ||
| 10 | HK3 | 3224 477 | 6649 | 0.008 | 0.5451 | No | ||
| 11 | GCK | 20535 | 6732 | 0.008 | 0.5414 | No | ||
| 12 | GLA | 4362 | 8788 | 0.002 | 0.4311 | No | ||
| 13 | FBP2 | 21422 | 9716 | -0.001 | 0.3813 | No | ||
| 14 | PFKP | 3267 3168 7118 | 11796 | -0.006 | 0.2701 | No | ||
| 15 | PGM1 | 16841 | 12021 | -0.007 | 0.2588 | No | ||
| 16 | MGAM | 17476 | 12219 | -0.008 | 0.2489 | No | ||
| 17 | LALBA | 22141 | 12911 | -0.011 | 0.2129 | No | ||
| 18 | HK1 | 4854 | 13249 | -0.014 | 0.1961 | No | ||
| 19 | G6PC | 20656 | 13811 | -0.019 | 0.1678 | No | ||
| 20 | GALK2 | 14871 | 14105 | -0.023 | 0.1543 | No | ||
| 21 | B4GALT2 | 11990 | 15171 | -0.055 | 0.1024 | No | ||
| 22 | B4GALT1 | 15918 | 17774 | -0.844 | 0.0453 | No |