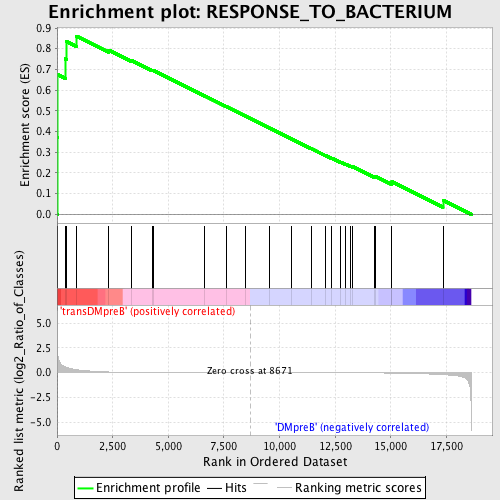
Profile of the Running ES Score & Positions of GeneSet Members on the Rank Ordered List
| Dataset | Set_04_transDMpreB_versus_DMpreB.phenotype_transDMpreB_versus_DMpreB.cls #transDMpreB_versus_DMpreB.phenotype_transDMpreB_versus_DMpreB.cls #transDMpreB_versus_DMpreB_repos |
| Phenotype | phenotype_transDMpreB_versus_DMpreB.cls#transDMpreB_versus_DMpreB_repos |
| Upregulated in class | transDMpreB |
| GeneSet | RESPONSE_TO_BACTERIUM |
| Enrichment Score (ES) | 0.86079156 |
| Normalized Enrichment Score (NES) | 1.6343571 |
| Nominal p-value | 0.005597015 |
| FDR q-value | 0.27405548 |
| FWER p-Value | 0.621 |
| PROBE | DESCRIPTION (from dataset) | GENE SYMBOL | GENE_TITLE | RANK IN GENE LIST | RANK METRIC SCORE | RUNNING ES | CORE ENRICHMENT | |
|---|---|---|---|---|---|---|---|---|
| 1 | IL10 | 14145 1510 1553 22902 | 14 | 2.242 | 0.3719 | Yes | ||
| 2 | CFP | 24174 | 26 | 1.829 | 0.6752 | Yes | ||
| 3 | PGLYRP1 | 18369 | 368 | 0.568 | 0.7513 | Yes | ||
| 4 | CAMP | 18990 | 429 | 0.516 | 0.8338 | Yes | ||
| 5 | IL12A | 4913 | 864 | 0.303 | 0.8608 | Yes | ||
| 6 | NOD2 | 6384 | 2323 | 0.066 | 0.7934 | No | ||
| 7 | NOD1 | 17141 | 3326 | 0.028 | 0.7442 | No | ||
| 8 | STAB2 | 19656 | 4282 | 0.015 | 0.6954 | No | ||
| 9 | SPACA3 | 13680 | 4331 | 0.015 | 0.6952 | No | ||
| 10 | CHIT1 | 14132 | 6644 | 0.004 | 0.5716 | No | ||
| 11 | SPN | 452 5493 | 7595 | 0.002 | 0.5208 | No | ||
| 12 | PGLYRP3 | 10812 | 8448 | 0.000 | 0.4751 | No | ||
| 13 | STAB1 | 21892 | 9552 | -0.002 | 0.4161 | No | ||
| 14 | WFDC12 | 14356 | 10538 | -0.004 | 0.3638 | No | ||
| 15 | DEFB103A | 18665 | 11435 | -0.007 | 0.3167 | No | ||
| 16 | CD24 | 8711 | 12061 | -0.009 | 0.2846 | No | ||
| 17 | TLR6 | 215 16528 | 12328 | -0.010 | 0.2719 | No | ||
| 18 | DMBT1 | 18050 | 12747 | -0.012 | 0.2515 | No | ||
| 19 | TLR3 | 18884 | 12979 | -0.014 | 0.2413 | No | ||
| 20 | PGLYRP2 | 7174 | 13182 | -0.015 | 0.2329 | No | ||
| 21 | LALBA | 22141 | 13290 | -0.016 | 0.2298 | No | ||
| 22 | DEFB127 | 622 | 14246 | -0.026 | 0.1827 | No | ||
| 23 | NLRC4 | 11225 | 14300 | -0.027 | 0.1842 | No | ||
| 24 | PGLYRP4 | 11810 | 15040 | -0.042 | 0.1514 | No | ||
| 25 | SLC11A1 | 5189 9483 5190 | 15049 | -0.042 | 0.1580 | No | ||
| 26 | BCL10 | 15397 | 17346 | -0.203 | 0.0683 | No |

