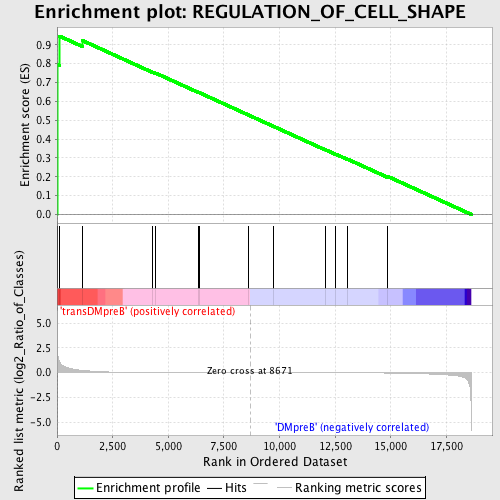
Profile of the Running ES Score & Positions of GeneSet Members on the Rank Ordered List
| Dataset | Set_04_transDMpreB_versus_DMpreB.phenotype_transDMpreB_versus_DMpreB.cls #transDMpreB_versus_DMpreB.phenotype_transDMpreB_versus_DMpreB.cls #transDMpreB_versus_DMpreB_repos |
| Phenotype | phenotype_transDMpreB_versus_DMpreB.cls#transDMpreB_versus_DMpreB_repos |
| Upregulated in class | transDMpreB |
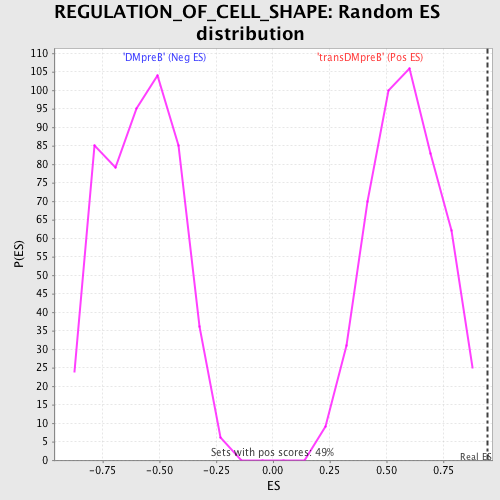
| GeneSet | REGULATION_OF_CELL_SHAPE |
| Enrichment Score (ES) | 0.9463057 |
| Normalized Enrichment Score (NES) | 1.6176968 |
| Nominal p-value | 0.0 |
| FDR q-value | 0.16970614 |
| FWER p-Value | 0.769 |
| PROBE | DESCRIPTION (from dataset) | GENE SYMBOL | GENE_TITLE | RANK IN GENE LIST | RANK METRIC SCORE | RUNNING ES | CORE ENRICHMENT | |
|---|---|---|---|---|---|---|---|---|
| 1 | MYH9 | 2252 2244 | 1 | 5.596 | 0.7939 | Yes | ||
| 2 | FGD2 | 23309 | 109 | 1.115 | 0.9463 | Yes | ||
| 3 | CDC42EP1 | 22433 10435 13411 11239 | 1137 | 0.224 | 0.9229 | No | ||
| 4 | FGD3 | 11399 | 4302 | 0.015 | 0.7550 | No | ||
| 5 | FGD4 | 10306 5870 1717 1669 1700 | 4433 | 0.014 | 0.7500 | No | ||
| 6 | CDC42EP5 | 17991 | 6350 | 0.005 | 0.6477 | No | ||
| 7 | CENTD2 | 1758 18169 2284 | 6381 | 0.005 | 0.6468 | No | ||
| 8 | FGD6 | 19901 | 8581 | 0.000 | 0.5287 | No | ||
| 9 | FGD1 | 24228 | 9726 | -0.002 | 0.4675 | No | ||
| 10 | TAOK2 | 10610 3794 | 12059 | -0.009 | 0.3434 | No | ||
| 11 | CDC42EP2 | 4180 14771 | 12523 | -0.011 | 0.3201 | No | ||
| 12 | CDC42EP4 | 20163 | 13046 | -0.014 | 0.2940 | No | ||
| 13 | FGD5 | 10555 17352 | 14846 | -0.038 | 0.2026 | No |