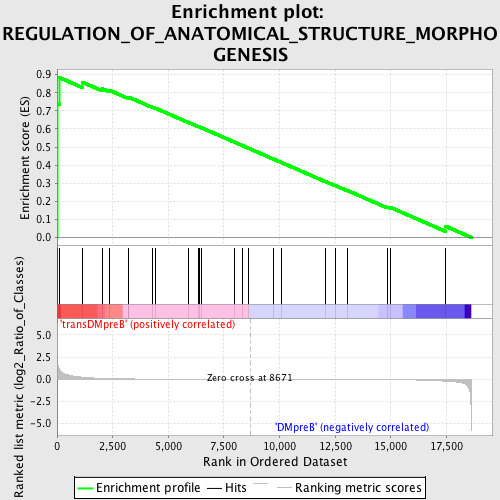
Profile of the Running ES Score & Positions of GeneSet Members on the Rank Ordered List
| Dataset | Set_04_transDMpreB_versus_DMpreB.phenotype_transDMpreB_versus_DMpreB.cls #transDMpreB_versus_DMpreB.phenotype_transDMpreB_versus_DMpreB.cls #transDMpreB_versus_DMpreB_repos |
| Phenotype | phenotype_transDMpreB_versus_DMpreB.cls#transDMpreB_versus_DMpreB_repos |
| Upregulated in class | transDMpreB |
| GeneSet | REGULATION_OF_ANATOMICAL_STRUCTURE_MORPHOGENESIS |
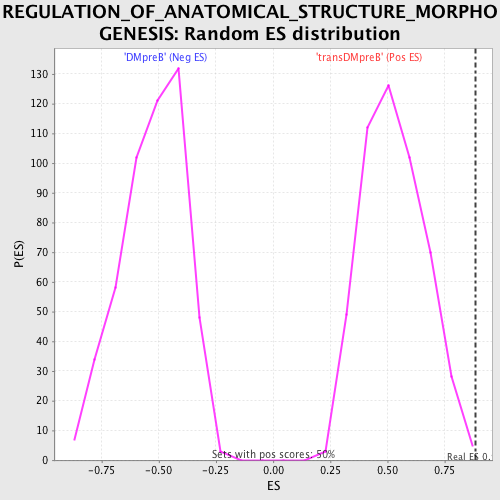
| Enrichment Score (ES) | 0.8838586 |
| Normalized Enrichment Score (NES) | 1.6759214 |
| Nominal p-value | 0.004040404 |
| FDR q-value | 0.30365676 |
| FWER p-Value | 0.298 |
| PROBE | DESCRIPTION (from dataset) | GENE SYMBOL | GENE_TITLE | RANK IN GENE LIST | RANK METRIC SCORE | RUNNING ES | CORE ENRICHMENT | |
|---|---|---|---|---|---|---|---|---|
| 1 | MYH9 | 2252 2244 | 1 | 5.596 | 0.7418 | Yes | ||
| 2 | FGD2 | 23309 | 109 | 1.115 | 0.8839 | Yes | ||
| 3 | CDC42EP1 | 22433 10435 13411 11239 | 1137 | 0.224 | 0.8584 | No | ||
| 4 | THY1 | 19481 | 2023 | 0.090 | 0.8227 | No | ||
| 5 | APOE | 8618 | 2354 | 0.065 | 0.8135 | No | ||
| 6 | RTN4 | 7569 1328 1343 1442 | 3201 | 0.032 | 0.7722 | No | ||
| 7 | ROBO2 | 6501 | 3210 | 0.031 | 0.7759 | No | ||
| 8 | FGD3 | 11399 | 4302 | 0.015 | 0.7192 | No | ||
| 9 | FGD4 | 10306 5870 1717 1669 1700 | 4433 | 0.014 | 0.7140 | No | ||
| 10 | CDC42 | 4503 8722 4504 2465 | 5905 | 0.007 | 0.6358 | No | ||
| 11 | CDC42EP5 | 17991 | 6350 | 0.005 | 0.6126 | No | ||
| 12 | CENTD2 | 1758 18169 2284 | 6381 | 0.005 | 0.6117 | No | ||
| 13 | SLIT2 | 5456 | 6511 | 0.005 | 0.6054 | No | ||
| 14 | KLK8 | 18269 18271 | 7974 | 0.001 | 0.5269 | No | ||
| 15 | ROBO1 | 9731 | 8310 | 0.001 | 0.5090 | No | ||
| 16 | FGD6 | 19901 | 8581 | 0.000 | 0.4945 | No | ||
| 17 | FGD1 | 24228 | 9726 | -0.002 | 0.4333 | No | ||
| 18 | YWHAH | 5937 10368 | 10098 | -0.003 | 0.4138 | No | ||
| 19 | TAOK2 | 10610 3794 | 12059 | -0.009 | 0.3095 | No | ||
| 20 | CDC42EP2 | 4180 14771 | 12523 | -0.011 | 0.2861 | No | ||
| 21 | CDC42EP4 | 20163 | 13046 | -0.014 | 0.2599 | No | ||
| 22 | FGD5 | 10555 17352 | 14846 | -0.038 | 0.1681 | No | ||
| 23 | MAPT | 9420 1347 | 14996 | -0.041 | 0.1655 | No | ||
| 24 | AMIGO1 | 15453 | 17462 | -0.220 | 0.0621 | No |