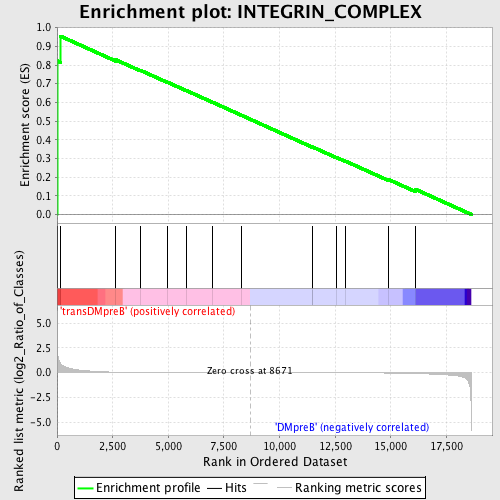
Profile of the Running ES Score & Positions of GeneSet Members on the Rank Ordered List
| Dataset | Set_04_transDMpreB_versus_DMpreB.phenotype_transDMpreB_versus_DMpreB.cls #transDMpreB_versus_DMpreB.phenotype_transDMpreB_versus_DMpreB.cls #transDMpreB_versus_DMpreB_repos |
| Phenotype | phenotype_transDMpreB_versus_DMpreB.cls#transDMpreB_versus_DMpreB_repos |
| Upregulated in class | transDMpreB |
| GeneSet | INTEGRIN_COMPLEX |
| Enrichment Score (ES) | 0.9547136 |
| Normalized Enrichment Score (NES) | 1.6503044 |
| Nominal p-value | 0.0 |
| FDR q-value | 0.28472096 |
| FWER p-Value | 0.483 |
| PROBE | DESCRIPTION (from dataset) | GENE SYMBOL | GENE_TITLE | RANK IN GENE LIST | RANK METRIC SCORE | RUNNING ES | CORE ENRICHMENT | |
|---|---|---|---|---|---|---|---|---|
| 1 | MYH9 | 2252 2244 | 1 | 5.596 | 0.8226 | Yes | ||
| 2 | ITGB7 | 22112 | 146 | 0.951 | 0.9547 | Yes | ||
| 3 | ITGA10 | 15493 | 2642 | 0.049 | 0.8278 | No | ||
| 4 | ITGB3 | 20631 | 3749 | 0.021 | 0.7714 | No | ||
| 5 | ITGA5 | 22105 | 4968 | 0.010 | 0.7075 | No | ||
| 6 | ITGAX | 18058 | 5823 | 0.007 | 0.6626 | No | ||
| 7 | ITGB6 | 14581 2809 | 6996 | 0.004 | 0.6001 | No | ||
| 8 | ITGA11 | 6677 11449 | 8300 | 0.001 | 0.5302 | No | ||
| 9 | ITGAE | 20791 1481 1397 1380 1278 1238 1359 | 11457 | -0.007 | 0.3615 | No | ||
| 10 | ITGA3 | 20284 | 11500 | -0.007 | 0.3603 | No | ||
| 11 | ITGAM | 9188 | 12542 | -0.011 | 0.3059 | No | ||
| 12 | ITGA8 | 14685 | 12976 | -0.014 | 0.2847 | No | ||
| 13 | ITGB4 | 9669 159 | 14901 | -0.039 | 0.1869 | No | ||
| 14 | ITGA9 | 19280 | 16121 | -0.086 | 0.1341 | No |

