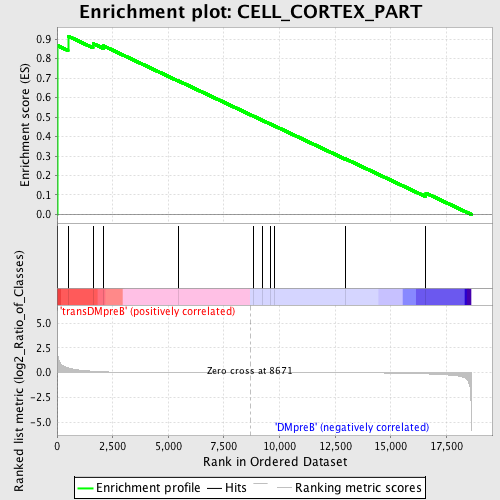
Profile of the Running ES Score & Positions of GeneSet Members on the Rank Ordered List
| Dataset | Set_04_transDMpreB_versus_DMpreB.phenotype_transDMpreB_versus_DMpreB.cls #transDMpreB_versus_DMpreB.phenotype_transDMpreB_versus_DMpreB.cls #transDMpreB_versus_DMpreB_repos |
| Phenotype | phenotype_transDMpreB_versus_DMpreB.cls#transDMpreB_versus_DMpreB_repos |
| Upregulated in class | transDMpreB |
| GeneSet | CELL_CORTEX_PART |
| Enrichment Score (ES) | 0.91534555 |
| Normalized Enrichment Score (NES) | 1.4976975 |
| Nominal p-value | 0.01 |
| FDR q-value | 0.5732864 |
| FWER p-Value | 1.0 |
| PROBE | DESCRIPTION (from dataset) | GENE SYMBOL | GENE_TITLE | RANK IN GENE LIST | RANK METRIC SCORE | RUNNING ES | CORE ENRICHMENT | |
|---|---|---|---|---|---|---|---|---|
| 1 | MYH9 | 2252 2244 | 1 | 5.596 | 0.8678 | Yes | ||
| 2 | SLC4A1 | 20204 | 491 | 0.476 | 0.9153 | Yes | ||
| 3 | ANLN | 7581 3138 12730 | 1615 | 0.143 | 0.8772 | No | ||
| 4 | CLASP1 | 14159 | 2074 | 0.086 | 0.8658 | No | ||
| 5 | MAPRE1 | 4652 | 5436 | 0.008 | 0.6865 | No | ||
| 6 | GYS2 | 16941 | 8812 | -0.000 | 0.5051 | No | ||
| 7 | SPTBN4 | 13471 1104 | 9243 | -0.001 | 0.4822 | No | ||
| 8 | PRKCI | 9576 | 9604 | -0.002 | 0.4631 | No | ||
| 9 | TRPC4 | 15593 | 9756 | -0.002 | 0.4554 | No | ||
| 10 | LASP1 | 4986 4985 1248 | 12945 | -0.013 | 0.2861 | No | ||
| 11 | GYPC | 23474 | 16578 | -0.120 | 0.1095 | No |

