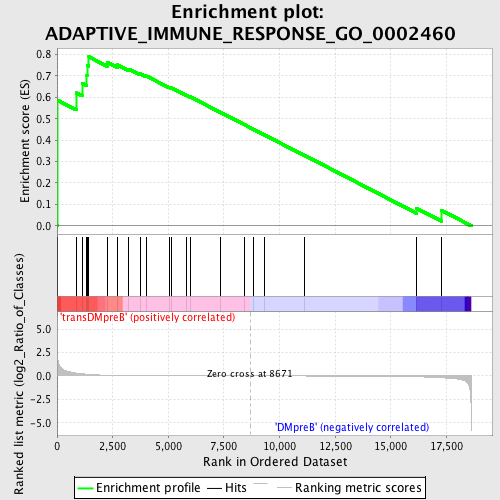
Profile of the Running ES Score & Positions of GeneSet Members on the Rank Ordered List
| Dataset | Set_04_transDMpreB_versus_DMpreB.phenotype_transDMpreB_versus_DMpreB.cls #transDMpreB_versus_DMpreB.phenotype_transDMpreB_versus_DMpreB.cls #transDMpreB_versus_DMpreB_repos |
| Phenotype | phenotype_transDMpreB_versus_DMpreB.cls#transDMpreB_versus_DMpreB_repos |
| Upregulated in class | transDMpreB |
| GeneSet | ADAPTIVE_IMMUNE_RESPONSE_GO_0002460 |
| Enrichment Score (ES) | 0.78886026 |
| Normalized Enrichment Score (NES) | 1.4625292 |
| Nominal p-value | 0.023904383 |
| FDR q-value | 0.7502734 |
| FWER p-Value | 1.0 |
| PROBE | DESCRIPTION (from dataset) | GENE SYMBOL | GENE_TITLE | RANK IN GENE LIST | RANK METRIC SCORE | RUNNING ES | CORE ENRICHMENT | |
|---|---|---|---|---|---|---|---|---|
| 1 | IL10 | 14145 1510 1553 22902 | 14 | 2.242 | 0.5866 | Yes | ||
| 2 | IL12A | 4913 | 864 | 0.303 | 0.6204 | Yes | ||
| 3 | MALT1 | 6274 | 1125 | 0.226 | 0.6657 | Yes | ||
| 4 | MAP3K7 | 16255 | 1335 | 0.182 | 0.7022 | Yes | ||
| 5 | TRAF2 | 14657 | 1349 | 0.180 | 0.7485 | Yes | ||
| 6 | EBI3 | 23193 | 1428 | 0.170 | 0.7889 | Yes | ||
| 7 | IL18BP | 17730 | 2247 | 0.072 | 0.7636 | No | ||
| 8 | TNFSF13 | 12806 | 2703 | 0.046 | 0.7513 | No | ||
| 9 | TGFB1 | 18332 | 3230 | 0.031 | 0.7311 | No | ||
| 10 | FOXP3 | 9804 5426 | 3729 | 0.021 | 0.7099 | No | ||
| 11 | IL4 | 9174 | 4010 | 0.018 | 0.6995 | No | ||
| 12 | CADM1 | 7057 | 5034 | 0.010 | 0.6472 | No | ||
| 13 | TLR8 | 9308 | 5147 | 0.010 | 0.6437 | No | ||
| 14 | SOCS5 | 1619 23141 | 5821 | 0.007 | 0.6093 | No | ||
| 15 | PTPRC | 5327 9662 | 5983 | 0.006 | 0.6023 | No | ||
| 16 | IL12B | 20918 | 7351 | 0.003 | 0.5295 | No | ||
| 17 | IL27 | 17636 | 8418 | 0.001 | 0.4723 | No | ||
| 18 | CD40LG | 24330 | 8842 | -0.000 | 0.4496 | No | ||
| 19 | IL18 | 9172 | 9316 | -0.001 | 0.4246 | No | ||
| 20 | CRTAM | 19160 | 11108 | -0.006 | 0.3297 | No | ||
| 21 | C2 | 23013 | 16152 | -0.089 | 0.0818 | No | ||
| 22 | TRAF6 | 5797 14940 | 17265 | -0.193 | 0.0727 | No |

