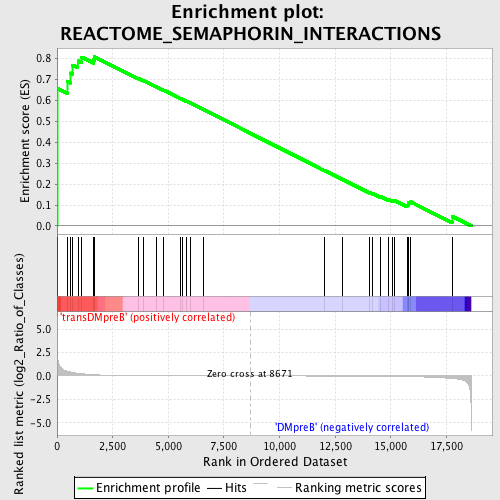
Profile of the Running ES Score & Positions of GeneSet Members on the Rank Ordered List
| Dataset | Set_04_transDMpreB_versus_DMpreB.phenotype_transDMpreB_versus_DMpreB.cls #transDMpreB_versus_DMpreB.phenotype_transDMpreB_versus_DMpreB.cls #transDMpreB_versus_DMpreB_repos |
| Phenotype | phenotype_transDMpreB_versus_DMpreB.cls#transDMpreB_versus_DMpreB_repos |
| Upregulated in class | transDMpreB |
| GeneSet | REACTOME_SEMAPHORIN_INTERACTIONS |
| Enrichment Score (ES) | 0.80782974 |
| Normalized Enrichment Score (NES) | 1.5619143 |
| Nominal p-value | 0.012048192 |
| FDR q-value | 0.6517083 |
| FWER p-Value | 0.942 |
| PROBE | DESCRIPTION (from dataset) | GENE SYMBOL | GENE_TITLE | RANK IN GENE LIST | RANK METRIC SCORE | RUNNING ES | CORE ENRICHMENT | |
|---|---|---|---|---|---|---|---|---|
| 1 | MYH9 | 2252 2244 | 1 | 5.596 | 0.6571 | Yes | ||
| 2 | ROCK1 | 5386 | 458 | 0.495 | 0.6907 | Yes | ||
| 3 | HSP90AB1 | 4880 9130 4881 | 606 | 0.408 | 0.7307 | Yes | ||
| 4 | ARHGEF11 | 10028 | 701 | 0.361 | 0.7681 | Yes | ||
| 5 | RHOG | 17727 | 938 | 0.280 | 0.7882 | Yes | ||
| 6 | RRAS | 18256 | 1108 | 0.230 | 0.8061 | Yes | ||
| 7 | CDK5 | 16591 | 1632 | 0.139 | 0.7943 | Yes | ||
| 8 | TYROBP | 18302 | 1673 | 0.133 | 0.8078 | Yes | ||
| 9 | PAK1 | 9527 | 3642 | 0.023 | 0.7046 | No | ||
| 10 | PIP5K1C | 5250 19929 | 3871 | 0.020 | 0.6947 | No | ||
| 11 | SEMA3A | 16919 | 4448 | 0.014 | 0.6653 | No | ||
| 12 | LIMK1 | 16350 | 4780 | 0.012 | 0.6488 | No | ||
| 13 | DPYSL2 | 3122 4561 8787 | 5559 | 0.008 | 0.6079 | No | ||
| 14 | PLXNC1 | 7056 | 5618 | 0.008 | 0.6057 | No | ||
| 15 | SEMA7A | 19426 9803 | 5814 | 0.007 | 0.5960 | No | ||
| 16 | PTPRC | 5327 9662 | 5983 | 0.006 | 0.5877 | No | ||
| 17 | RHOA | 8624 4409 4410 | 6567 | 0.005 | 0.5569 | No | ||
| 18 | SEMA3E | 16918 | 12002 | -0.009 | 0.2655 | No | ||
| 19 | FES | 17779 3949 | 12817 | -0.013 | 0.2232 | No | ||
| 20 | MET | 17520 | 14045 | -0.023 | 0.1599 | No | ||
| 21 | ERBB2 | 8913 | 14185 | -0.025 | 0.1553 | No | ||
| 22 | FARP2 | 14175 | 14530 | -0.031 | 0.1404 | No | ||
| 23 | SEMA5A | 22496 5423 | 14904 | -0.039 | 0.1249 | No | ||
| 24 | SEMA6D | 2800 14876 90 | 15085 | -0.043 | 0.1203 | No | ||
| 25 | CDK5R1 | 20745 | 15153 | -0.045 | 0.1220 | No | ||
| 26 | CD72 | 8718 | 15729 | -0.066 | 0.0989 | No | ||
| 27 | ITGB1 | 3872 18411 | 15782 | -0.069 | 0.1042 | No | ||
| 28 | FYN | 3375 3395 20052 | 15795 | -0.069 | 0.1117 | No | ||
| 29 | CFL1 | 4516 | 15903 | -0.075 | 0.1147 | No | ||
| 30 | MYL6 | 9438 3408 | 17758 | -0.266 | 0.0462 | No |

