Profile of the Running ES Score & Positions of GeneSet Members on the Rank Ordered List
| Dataset | Set_04_transDMpreB_versus_DMpreB.phenotype_transDMpreB_versus_DMpreB.cls #transDMpreB_versus_DMpreB.phenotype_transDMpreB_versus_DMpreB.cls #transDMpreB_versus_DMpreB_repos |
| Phenotype | phenotype_transDMpreB_versus_DMpreB.cls#transDMpreB_versus_DMpreB_repos |
| Upregulated in class | transDMpreB |
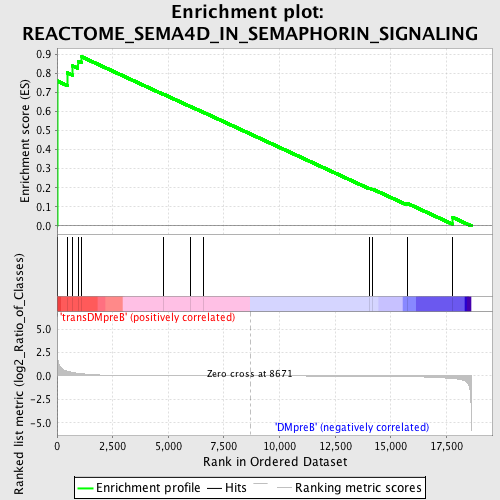
| GeneSet | REACTOME_SEMA4D_IN_SEMAPHORIN_SIGNALING |
| Enrichment Score (ES) | 0.88602984 |
| Normalized Enrichment Score (NES) | 1.4995974 |
| Nominal p-value | 0.022540983 |
| FDR q-value | 0.92992365 |
| FWER p-Value | 1.0 |
| PROBE | DESCRIPTION (from dataset) | GENE SYMBOL | GENE_TITLE | RANK IN GENE LIST | RANK METRIC SCORE | RUNNING ES | CORE ENRICHMENT | |
|---|---|---|---|---|---|---|---|---|
| 1 | MYH9 | 2252 2244 | 1 | 5.596 | 0.7599 | Yes | ||
| 2 | ROCK1 | 5386 | 458 | 0.495 | 0.8025 | Yes | ||
| 3 | ARHGEF11 | 10028 | 701 | 0.361 | 0.8386 | Yes | ||
| 4 | RHOG | 17727 | 938 | 0.280 | 0.8639 | Yes | ||
| 5 | RRAS | 18256 | 1108 | 0.230 | 0.8860 | Yes | ||
| 6 | LIMK1 | 16350 | 4780 | 0.012 | 0.6903 | No | ||
| 7 | PTPRC | 5327 9662 | 5983 | 0.006 | 0.6265 | No | ||
| 8 | RHOA | 8624 4409 4410 | 6567 | 0.005 | 0.5958 | No | ||
| 9 | MET | 17520 | 14045 | -0.023 | 0.1971 | No | ||
| 10 | ERBB2 | 8913 | 14185 | -0.025 | 0.1930 | No | ||
| 11 | CD72 | 8718 | 15729 | -0.066 | 0.1191 | No | ||
| 12 | MYL6 | 9438 3408 | 17758 | -0.266 | 0.0461 | No |

