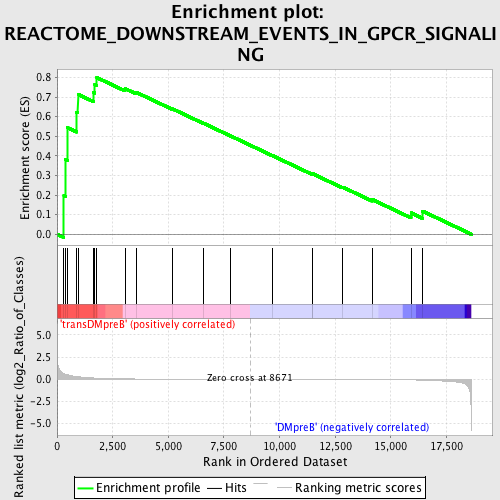
Profile of the Running ES Score & Positions of GeneSet Members on the Rank Ordered List
| Dataset | Set_04_transDMpreB_versus_DMpreB.phenotype_transDMpreB_versus_DMpreB.cls #transDMpreB_versus_DMpreB.phenotype_transDMpreB_versus_DMpreB.cls #transDMpreB_versus_DMpreB_repos |
| Phenotype | phenotype_transDMpreB_versus_DMpreB.cls#transDMpreB_versus_DMpreB_repos |
| Upregulated in class | transDMpreB |
| GeneSet | REACTOME_DOWNSTREAM_EVENTS_IN_GPCR_SIGNALING |
| Enrichment Score (ES) | 0.7990475 |
| Normalized Enrichment Score (NES) | 1.44057 |
| Nominal p-value | 0.035051547 |
| FDR q-value | 0.8576672 |
| FWER p-Value | 1.0 |
| PROBE | DESCRIPTION (from dataset) | GENE SYMBOL | GENE_TITLE | RANK IN GENE LIST | RANK METRIC SCORE | RUNNING ES | CORE ENRICHMENT | |
|---|---|---|---|---|---|---|---|---|
| 1 | PIK3CG | 6635 | 307 | 0.628 | 0.1958 | Yes | ||
| 2 | GNAS | 9025 2963 2752 | 376 | 0.559 | 0.3809 | Yes | ||
| 3 | ROCK1 | 5386 | 458 | 0.495 | 0.5437 | Yes | ||
| 4 | ADRBK1 | 23960 | 874 | 0.299 | 0.6225 | Yes | ||
| 5 | RHOG | 17727 | 938 | 0.280 | 0.7136 | Yes | ||
| 6 | GNG2 | 4790 | 1631 | 0.139 | 0.7234 | Yes | ||
| 7 | GNA13 | 20617 | 1696 | 0.130 | 0.7637 | Yes | ||
| 8 | PDPK1 | 23097 | 1785 | 0.119 | 0.7990 | Yes | ||
| 9 | PLCB2 | 5262 | 3051 | 0.035 | 0.7429 | No | ||
| 10 | PDE4D | 10722 6235 | 3548 | 0.024 | 0.7244 | No | ||
| 11 | GNAQ | 4786 23909 3685 | 5192 | 0.009 | 0.6392 | No | ||
| 12 | RHOA | 8624 4409 4410 | 6567 | 0.005 | 0.5669 | No | ||
| 13 | PIK3R1 | 3170 | 7781 | 0.002 | 0.5022 | No | ||
| 14 | AKT1 | 8568 | 9661 | -0.002 | 0.4019 | No | ||
| 15 | ADCY6 | 22139 2283 8551 | 11485 | -0.007 | 0.3062 | No | ||
| 16 | PIK3CA | 9562 | 11488 | -0.007 | 0.3084 | No | ||
| 17 | GNA12 | 9023 | 12834 | -0.013 | 0.2404 | No | ||
| 18 | GRK5 | 9036 23814 | 14155 | -0.024 | 0.1776 | No | ||
| 19 | GNAZ | 71 | 15908 | -0.075 | 0.1088 | No | ||
| 20 | GNB1 | 15967 | 16431 | -0.109 | 0.1175 | No |

