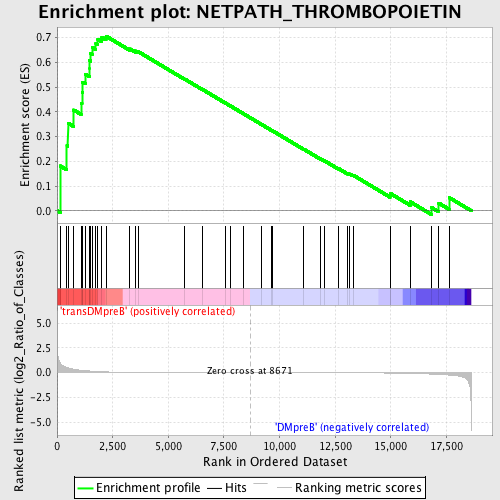
Profile of the Running ES Score & Positions of GeneSet Members on the Rank Ordered List
| Dataset | Set_04_transDMpreB_versus_DMpreB.phenotype_transDMpreB_versus_DMpreB.cls #transDMpreB_versus_DMpreB.phenotype_transDMpreB_versus_DMpreB.cls #transDMpreB_versus_DMpreB_repos |
| Phenotype | phenotype_transDMpreB_versus_DMpreB.cls#transDMpreB_versus_DMpreB_repos |
| Upregulated in class | transDMpreB |
| GeneSet | NETPATH_THROMBOPOIETIN |
| Enrichment Score (ES) | 0.7063309 |
| Normalized Enrichment Score (NES) | 1.4435451 |
| Nominal p-value | 0.035928145 |
| FDR q-value | 0.9233926 |
| FWER p-Value | 1.0 |
| PROBE | DESCRIPTION (from dataset) | GENE SYMBOL | GENE_TITLE | RANK IN GENE LIST | RANK METRIC SCORE | RUNNING ES | CORE ENRICHMENT | |
|---|---|---|---|---|---|---|---|---|
| 1 | TP53 | 20822 | 141 | 0.968 | 0.1813 | Yes | ||
| 2 | ZFPM1 | 18439 | 443 | 0.505 | 0.2637 | Yes | ||
| 3 | PTPN6 | 17002 | 489 | 0.478 | 0.3546 | Yes | ||
| 4 | STAT3 | 5525 9906 | 746 | 0.342 | 0.4075 | Yes | ||
| 5 | PRKCD | 21897 | 1081 | 0.237 | 0.4358 | Yes | ||
| 6 | MAP2K1 | 19082 | 1120 | 0.227 | 0.4781 | Yes | ||
| 7 | GRB2 | 20149 | 1140 | 0.224 | 0.5208 | Yes | ||
| 8 | MAPK3 | 6458 11170 | 1268 | 0.198 | 0.5525 | Yes | ||
| 9 | TEC | 16514 | 1450 | 0.167 | 0.5753 | Yes | ||
| 10 | RAF1 | 17035 | 1454 | 0.166 | 0.6075 | Yes | ||
| 11 | JAK1 | 15827 | 1502 | 0.159 | 0.6359 | Yes | ||
| 12 | VAV1 | 23173 | 1577 | 0.148 | 0.6608 | Yes | ||
| 13 | PRKCZ | 5260 | 1742 | 0.124 | 0.6761 | Yes | ||
| 14 | MAP2K2 | 19933 | 1831 | 0.114 | 0.6936 | Yes | ||
| 15 | IRF2 | 18621 | 2010 | 0.091 | 0.7018 | Yes | ||
| 16 | STAT5A | 20664 | 2200 | 0.075 | 0.7063 | Yes | ||
| 17 | GATA1 | 24196 | 3273 | 0.030 | 0.6544 | No | ||
| 18 | CBL | 19154 | 3514 | 0.025 | 0.6463 | No | ||
| 19 | JAK2 | 23893 9197 3706 | 3648 | 0.023 | 0.6436 | No | ||
| 20 | SOS1 | 5476 | 5736 | 0.007 | 0.5326 | No | ||
| 21 | POU2F1 | 5275 3989 4065 4010 | 6547 | 0.005 | 0.4899 | No | ||
| 22 | CRK | 4559 1249 | 7552 | 0.002 | 0.4363 | No | ||
| 23 | PIK3R1 | 3170 | 7781 | 0.002 | 0.4244 | No | ||
| 24 | LYN | 16281 | 8372 | 0.001 | 0.3928 | No | ||
| 25 | PRKCE | 9575 | 9168 | -0.001 | 0.3502 | No | ||
| 26 | THPO | 22636 | 9640 | -0.002 | 0.3252 | No | ||
| 27 | AKT1 | 8568 | 9661 | -0.002 | 0.3246 | No | ||
| 28 | MPL | 15780 | 11074 | -0.006 | 0.2497 | No | ||
| 29 | STAT5B | 20222 | 11851 | -0.008 | 0.2095 | No | ||
| 30 | PTPN11 | 5326 16391 9660 | 12011 | -0.009 | 0.2026 | No | ||
| 31 | PIK3R2 | 18850 | 12644 | -0.012 | 0.1709 | No | ||
| 32 | FOXO3 | 19782 3402 | 13060 | -0.014 | 0.1513 | No | ||
| 33 | SHC1 | 9813 9812 5430 | 13160 | -0.015 | 0.1488 | No | ||
| 34 | GAB2 | 1821 18184 2025 | 13305 | -0.016 | 0.1442 | No | ||
| 35 | SOCS1 | 4522 | 14964 | -0.040 | 0.0628 | No | ||
| 36 | GAB1 | 18828 | 14997 | -0.041 | 0.0691 | No | ||
| 37 | STAT1 | 3936 5524 | 15868 | -0.073 | 0.0365 | No | ||
| 38 | HRAS | 4868 | 16826 | -0.145 | 0.0133 | No | ||
| 39 | CRKL | 4560 | 17157 | -0.181 | 0.0308 | No | ||
| 40 | MAPK1 | 1642 11167 | 17642 | -0.244 | 0.0524 | No |

