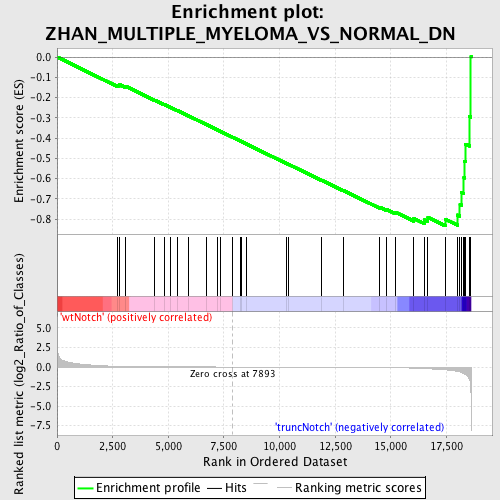
Profile of the Running ES Score & Positions of GeneSet Members on the Rank Ordered List
| Dataset | Set_03_wtNotch_versus_truncNotch.phenotype_wtNotch_versus_truncNotch.cls #wtNotch_versus_truncNotch.phenotype_wtNotch_versus_truncNotch.cls #wtNotch_versus_truncNotch_repos |
| Phenotype | phenotype_wtNotch_versus_truncNotch.cls#wtNotch_versus_truncNotch_repos |
| Upregulated in class | truncNotch |
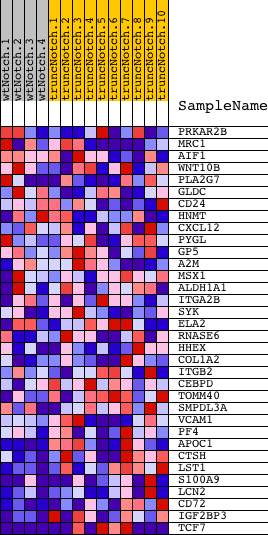
| GeneSet | ZHAN_MULTIPLE_MYELOMA_VS_NORMAL_DN |
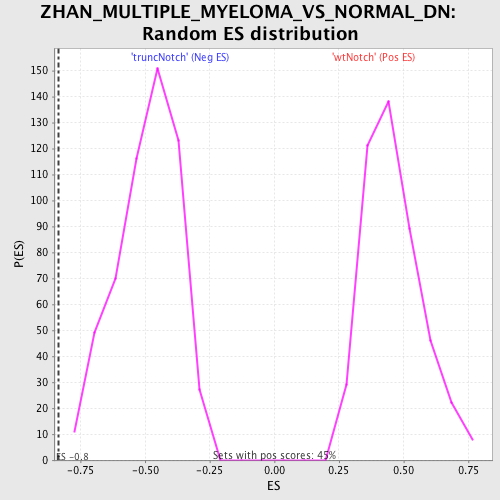
| Enrichment Score (ES) | -0.8334798 |
| Normalized Enrichment Score (NES) | -1.7078538 |
| Nominal p-value | 0.0 |
| FDR q-value | 0.2876104 |
| FWER p-Value | 0.263 |
| PROBE | DESCRIPTION (from dataset) | GENE SYMBOL | GENE_TITLE | RANK IN GENE LIST | RANK METRIC SCORE | RUNNING ES | CORE ENRICHMENT | |
|---|---|---|---|---|---|---|---|---|
| 1 | PRKAR2B | 3130593 5220577 | 2733 | 0.087 | -0.1391 | No | ||
| 2 | MRC1 | 730097 | 2811 | 0.081 | -0.1357 | No | ||
| 3 | AIF1 | 130332 5220017 | 3066 | 0.064 | -0.1435 | No | ||
| 4 | WNT10B | 510050 | 4386 | 0.020 | -0.2126 | No | ||
| 5 | PLA2G7 | 4730092 | 4828 | 0.014 | -0.2351 | No | ||
| 6 | GLDC | 1170324 | 5088 | 0.012 | -0.2479 | No | ||
| 7 | CD24 | 1780091 | 5389 | 0.010 | -0.2631 | No | ||
| 8 | HNMT | 4560022 | 5927 | 0.007 | -0.2914 | No | ||
| 9 | CXCL12 | 580546 4150750 4570068 | 6726 | 0.003 | -0.3340 | No | ||
| 10 | PYGL | 7160520 | 7218 | 0.002 | -0.3603 | No | ||
| 11 | GP5 | 2510088 | 7337 | 0.002 | -0.3665 | No | ||
| 12 | A2M | 6620039 | 7900 | -0.000 | -0.3967 | No | ||
| 13 | MSX1 | 2650309 | 8252 | -0.001 | -0.4155 | No | ||
| 14 | ALDH1A1 | 6520706 | 8282 | -0.001 | -0.4170 | No | ||
| 15 | ITGA2B | 2680538 | 8504 | -0.002 | -0.4287 | No | ||
| 16 | SYK | 6940133 | 10308 | -0.007 | -0.5251 | No | ||
| 17 | ELA2 | 1570452 5270129 | 10388 | -0.008 | -0.5286 | No | ||
| 18 | RNASE6 | 5270563 | 11905 | -0.015 | -0.6088 | No | ||
| 19 | HHEX | 2340575 | 12859 | -0.023 | -0.6579 | No | ||
| 20 | COL1A2 | 380364 | 14505 | -0.054 | -0.7415 | No | ||
| 21 | ITGB2 | 6380348 | 14805 | -0.064 | -0.7516 | No | ||
| 22 | CEBPD | 3360176 | 15219 | -0.082 | -0.7663 | No | ||
| 23 | TOMM40 | 6110017 | 16032 | -0.145 | -0.7965 | No | ||
| 24 | SMPDL3A | 4070253 | 16513 | -0.202 | -0.8036 | Yes | ||
| 25 | VCAM1 | 2900450 | 16667 | -0.222 | -0.7913 | Yes | ||
| 26 | PF4 | 6130332 | 17451 | -0.359 | -0.8002 | Yes | ||
| 27 | APOC1 | 5900066 6220408 | 17997 | -0.543 | -0.7793 | Yes | ||
| 28 | CTSH | 60524 | 18108 | -0.625 | -0.7273 | Yes | ||
| 29 | LST1 | 5420372 | 18182 | -0.684 | -0.6679 | Yes | ||
| 30 | S100A9 | 7050528 | 18285 | -0.837 | -0.5958 | Yes | ||
| 31 | LCN2 | 2510112 | 18310 | -0.888 | -0.5149 | Yes | ||
| 32 | CD72 | 2340369 | 18358 | -0.946 | -0.4299 | Yes | ||
| 33 | IGF2BP3 | 2810161 4230338 | 18534 | -1.572 | -0.2937 | Yes | ||
| 34 | TCF7 | 3800736 5390181 | 18602 | -3.219 | 0.0008 | Yes |