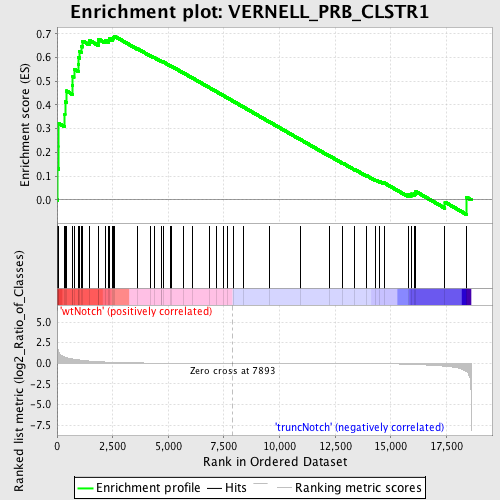
Profile of the Running ES Score & Positions of GeneSet Members on the Rank Ordered List
| Dataset | Set_03_wtNotch_versus_truncNotch.phenotype_wtNotch_versus_truncNotch.cls #wtNotch_versus_truncNotch.phenotype_wtNotch_versus_truncNotch.cls #wtNotch_versus_truncNotch_repos |
| Phenotype | phenotype_wtNotch_versus_truncNotch.cls#wtNotch_versus_truncNotch_repos |
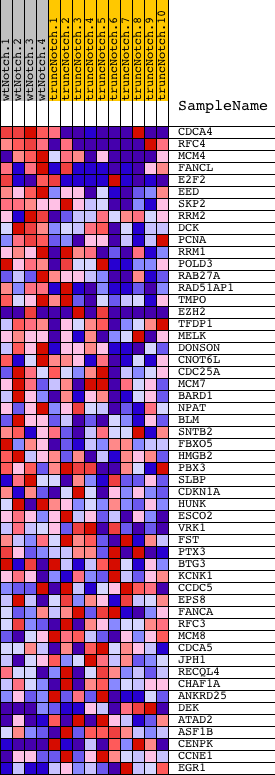
| Upregulated in class | wtNotch |
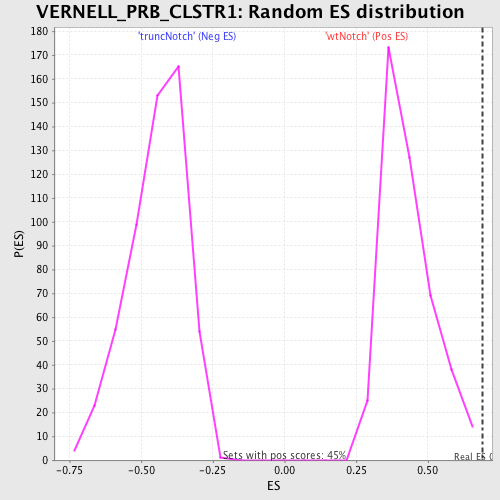
| GeneSet | VERNELL_PRB_CLSTR1 |
| Enrichment Score (ES) | 0.6901271 |
| Normalized Enrichment Score (NES) | 1.6097695 |
| Nominal p-value | 0.0022421526 |
| FDR q-value | 0.17157692 |
| FWER p-Value | 0.95 |
| PROBE | DESCRIPTION (from dataset) | GENE SYMBOL | GENE_TITLE | RANK IN GENE LIST | RANK METRIC SCORE | RUNNING ES | CORE ENRICHMENT | |
|---|---|---|---|---|---|---|---|---|
| 1 | CDCA4 | 5890315 6110487 | 24 | 1.834 | 0.1317 | Yes | ||
| 2 | RFC4 | 3800082 6840142 | 76 | 1.338 | 0.2259 | Yes | ||
| 3 | MCM4 | 2760673 5420711 | 78 | 1.324 | 0.3218 | Yes | ||
| 4 | FANCL | 2060520 5220066 5270164 | 346 | 0.742 | 0.3612 | Yes | ||
| 5 | E2F2 | 5270609 5570377 7000465 | 356 | 0.731 | 0.4137 | Yes | ||
| 6 | EED | 2320373 | 418 | 0.671 | 0.4590 | Yes | ||
| 7 | SKP2 | 360711 380093 4810368 | 685 | 0.521 | 0.4825 | Yes | ||
| 8 | RRM2 | 6350059 6940162 | 707 | 0.510 | 0.5183 | Yes | ||
| 9 | DCK | 6900411 | 760 | 0.485 | 0.5507 | Yes | ||
| 10 | PCNA | 940754 | 954 | 0.414 | 0.5703 | Yes | ||
| 11 | RRM1 | 4150433 | 972 | 0.408 | 0.5989 | Yes | ||
| 12 | POLD3 | 6400278 | 1013 | 0.388 | 0.6249 | Yes | ||
| 13 | RAB27A | 450019 | 1091 | 0.363 | 0.6471 | Yes | ||
| 14 | RAD51AP1 | 4050736 6370528 | 1145 | 0.349 | 0.6695 | Yes | ||
| 15 | TMPO | 4050494 | 1451 | 0.266 | 0.6723 | Yes | ||
| 16 | EZH2 | 6130605 6380524 | 1852 | 0.189 | 0.6645 | Yes | ||
| 17 | TFDP1 | 1980112 | 1860 | 0.187 | 0.6777 | Yes | ||
| 18 | MELK | 130022 5220537 | 2159 | 0.144 | 0.6721 | Yes | ||
| 19 | DONSON | 4780541 6130010 | 2306 | 0.126 | 0.6734 | Yes | ||
| 20 | CNOT6L | 4590333 | 2353 | 0.120 | 0.6796 | Yes | ||
| 21 | CDC25A | 3800184 | 2485 | 0.107 | 0.6803 | Yes | ||
| 22 | MCM7 | 3290292 5220056 | 2530 | 0.103 | 0.6854 | Yes | ||
| 23 | BARD1 | 3170348 | 2578 | 0.100 | 0.6901 | Yes | ||
| 24 | NPAT | 3800594 4670026 | 3629 | 0.037 | 0.6362 | No | ||
| 25 | BLM | 520619 5570170 | 4209 | 0.022 | 0.6067 | No | ||
| 26 | SNTB2 | 2630014 5390035 | 4355 | 0.020 | 0.6003 | No | ||
| 27 | FBXO5 | 2630551 | 4685 | 0.016 | 0.5837 | No | ||
| 28 | HMGB2 | 2640603 | 4698 | 0.016 | 0.5842 | No | ||
| 29 | PBX3 | 1300424 3710577 6180575 | 4765 | 0.015 | 0.5817 | No | ||
| 30 | SLBP | 6220601 | 5090 | 0.012 | 0.5651 | No | ||
| 31 | CDKN1A | 4050088 6400706 | 5145 | 0.011 | 0.5631 | No | ||
| 32 | HUNK | 7100139 | 5659 | 0.008 | 0.5360 | No | ||
| 33 | ESCO2 | 1170010 | 6104 | 0.006 | 0.5125 | No | ||
| 34 | VRK1 | 5890603 6900347 | 6850 | 0.003 | 0.4726 | No | ||
| 35 | FST | 1110600 | 7185 | 0.002 | 0.4548 | No | ||
| 36 | PTX3 | 870309 3520102 | 7463 | 0.001 | 0.4399 | No | ||
| 37 | BTG3 | 7050079 | 7664 | 0.001 | 0.4292 | No | ||
| 38 | KCNK1 | 1050068 | 7920 | -0.000 | 0.4155 | No | ||
| 39 | CCDC5 | 2480040 | 8383 | -0.001 | 0.3907 | No | ||
| 40 | EPS8 | 7050204 | 9549 | -0.005 | 0.3283 | No | ||
| 41 | FANCA | 6130070 | 10950 | -0.010 | 0.2535 | No | ||
| 42 | RFC3 | 1980600 | 12248 | -0.018 | 0.1849 | No | ||
| 43 | MCM8 | 6130743 | 12831 | -0.023 | 0.1553 | No | ||
| 44 | CDCA5 | 5670131 | 13385 | -0.030 | 0.1277 | No | ||
| 45 | JPH1 | 610739 | 13903 | -0.039 | 0.1026 | No | ||
| 46 | RECQL4 | 540551 | 14331 | -0.049 | 0.0832 | No | ||
| 47 | CHAF1A | 6040647 | 14493 | -0.054 | 0.0784 | No | ||
| 48 | ANKRD25 | 4850102 | 14698 | -0.060 | 0.0717 | No | ||
| 49 | DEK | 1050451 4560037 | 15792 | -0.121 | 0.0216 | No | ||
| 50 | ATAD2 | 870242 2260687 | 15909 | -0.131 | 0.0248 | No | ||
| 51 | ASF1B | 6590706 | 16056 | -0.147 | 0.0276 | No | ||
| 52 | CENPK | 1740722 6200068 | 16122 | -0.153 | 0.0352 | No | ||
| 53 | CCNE1 | 110064 | 17434 | -0.356 | -0.0096 | No | ||
| 54 | EGR1 | 4610347 | 18402 | -1.010 | 0.0115 | No |