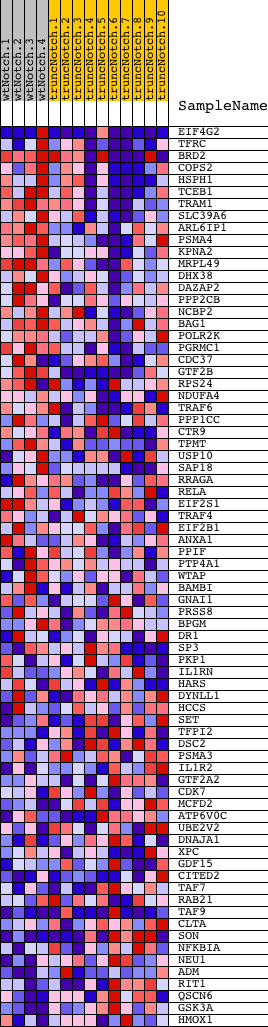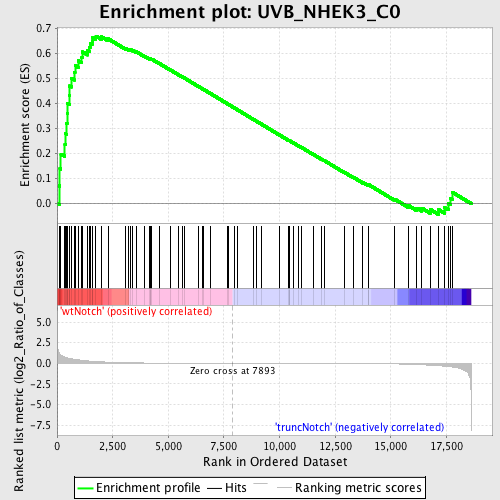
Profile of the Running ES Score & Positions of GeneSet Members on the Rank Ordered List
| Dataset | Set_03_wtNotch_versus_truncNotch.phenotype_wtNotch_versus_truncNotch.cls #wtNotch_versus_truncNotch.phenotype_wtNotch_versus_truncNotch.cls #wtNotch_versus_truncNotch_repos |
| Phenotype | phenotype_wtNotch_versus_truncNotch.cls#wtNotch_versus_truncNotch_repos |
| Upregulated in class | wtNotch |
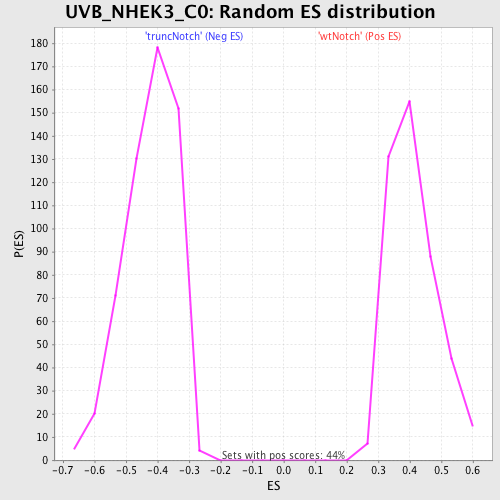
| GeneSet | UVB_NHEK3_C0 |
| Enrichment Score (ES) | 0.66971713 |
| Normalized Enrichment Score (NES) | 1.631289 |
| Nominal p-value | 0.0 |
| FDR q-value | 0.15909654 |
| FWER p-Value | 0.881 |
| PROBE | DESCRIPTION (from dataset) | GENE SYMBOL | GENE_TITLE | RANK IN GENE LIST | RANK METRIC SCORE | RUNNING ES | CORE ENRICHMENT | |
|---|---|---|---|---|---|---|---|---|
| 1 | EIF4G2 | 3800575 6860184 | 94 | 1.204 | 0.0718 | Yes | ||
| 2 | TFRC | 4050551 | 126 | 1.089 | 0.1396 | Yes | ||
| 3 | BRD2 | 1450300 5340484 6100605 | 172 | 0.960 | 0.1984 | Yes | ||
| 4 | COPS2 | 3060142 | 351 | 0.735 | 0.2357 | Yes | ||
| 5 | HSPH1 | 1690017 | 372 | 0.711 | 0.2800 | Yes | ||
| 6 | TCEB1 | 1170619 | 415 | 0.673 | 0.3207 | Yes | ||
| 7 | TRAM1 | 2340441 6620592 | 452 | 0.652 | 0.3603 | Yes | ||
| 8 | SLC39A6 | 6100072 | 463 | 0.644 | 0.4009 | Yes | ||
| 9 | ARL6IP1 | 2260278 | 555 | 0.590 | 0.4337 | Yes | ||
| 10 | PSMA4 | 4560427 | 565 | 0.585 | 0.4705 | Yes | ||
| 11 | KPNA2 | 3450114 | 646 | 0.540 | 0.5007 | Yes | ||
| 12 | MRPL49 | 460541 610162 5340156 | 770 | 0.482 | 0.5248 | Yes | ||
| 13 | DHX38 | 780243 | 807 | 0.469 | 0.5528 | Yes | ||
| 14 | DAZAP2 | 6200102 | 949 | 0.415 | 0.5717 | Yes | ||
| 15 | PPP2CB | 5570593 | 1111 | 0.356 | 0.5858 | Yes | ||
| 16 | NCBP2 | 5340500 | 1141 | 0.351 | 0.6066 | Yes | ||
| 17 | BAG1 | 460035 | 1373 | 0.287 | 0.6124 | Yes | ||
| 18 | POLR2K | 3870400 | 1460 | 0.264 | 0.6247 | Yes | ||
| 19 | PGRMC1 | 4150692 | 1488 | 0.259 | 0.6397 | Yes | ||
| 20 | CDC37 | 2570537 | 1575 | 0.240 | 0.6504 | Yes | ||
| 21 | GTF2B | 6860685 | 1592 | 0.236 | 0.6646 | Yes | ||
| 22 | RPS24 | 5420377 | 1746 | 0.210 | 0.6697 | Yes | ||
| 23 | NDUFA4 | 6860364 | 1987 | 0.170 | 0.6676 | No | ||
| 24 | TRAF6 | 4810292 6200132 | 2296 | 0.127 | 0.6591 | No | ||
| 25 | PPP1CC | 6380300 2510647 | 3072 | 0.063 | 0.6213 | No | ||
| 26 | CTR9 | 6980736 | 3226 | 0.054 | 0.6165 | No | ||
| 27 | TPMT | 6180025 | 3305 | 0.050 | 0.6155 | No | ||
| 28 | USP10 | 2030736 2450333 | 3407 | 0.046 | 0.6129 | No | ||
| 29 | SAP18 | 3610092 | 3548 | 0.040 | 0.6079 | No | ||
| 30 | RRAGA | 6400603 | 3948 | 0.027 | 0.5882 | No | ||
| 31 | RELA | 3830075 | 4139 | 0.024 | 0.5794 | No | ||
| 32 | EIF2S1 | 5360292 | 4181 | 0.023 | 0.5787 | No | ||
| 33 | TRAF4 | 3060041 4920528 6980286 | 4197 | 0.023 | 0.5793 | No | ||
| 34 | EIF2B1 | 4610082 7040242 | 4244 | 0.022 | 0.5782 | No | ||
| 35 | ANXA1 | 2320053 | 4598 | 0.017 | 0.5603 | No | ||
| 36 | PPIF | 1740059 | 5111 | 0.012 | 0.5334 | No | ||
| 37 | PTP4A1 | 130692 | 5470 | 0.009 | 0.5147 | No | ||
| 38 | WTAP | 4010176 | 5639 | 0.008 | 0.5061 | No | ||
| 39 | BAMBI | 6650463 | 5709 | 0.008 | 0.5029 | No | ||
| 40 | GNAI1 | 4560390 | 6364 | 0.005 | 0.4680 | No | ||
| 41 | PRSS8 | 3170577 | 6556 | 0.004 | 0.4579 | No | ||
| 42 | BPGM | 5080520 | 6576 | 0.004 | 0.4571 | No | ||
| 43 | DR1 | 5860750 | 6914 | 0.003 | 0.4392 | No | ||
| 44 | SP3 | 3840338 | 7644 | 0.001 | 0.3999 | No | ||
| 45 | PKP1 | 1500433 | 7698 | 0.001 | 0.3971 | No | ||
| 46 | IL1RN | 2370333 | 7976 | -0.000 | 0.3821 | No | ||
| 47 | HARS | 6100487 | 8106 | -0.001 | 0.3752 | No | ||
| 48 | DYNLL1 | 5570113 | 8846 | -0.003 | 0.3355 | No | ||
| 49 | HCCS | 670397 3170341 | 8951 | -0.003 | 0.3301 | No | ||
| 50 | SET | 6650286 | 9165 | -0.004 | 0.3189 | No | ||
| 51 | TFPI2 | 3870324 | 10009 | -0.006 | 0.2738 | No | ||
| 52 | DSC2 | 840484 | 10414 | -0.008 | 0.2525 | No | ||
| 53 | PSMA3 | 5900047 7040161 | 10426 | -0.008 | 0.2524 | No | ||
| 54 | IL1R2 | 1410600 | 10455 | -0.008 | 0.2514 | No | ||
| 55 | GTF2A2 | 2230184 | 10646 | -0.009 | 0.2417 | No | ||
| 56 | CDK7 | 2640451 | 10864 | -0.009 | 0.2306 | No | ||
| 57 | MCFD2 | 520576 5690017 | 10962 | -0.010 | 0.2260 | No | ||
| 58 | ATP6V0C | 1780609 | 11525 | -0.013 | 0.1965 | No | ||
| 59 | UBE2V2 | 4210484 | 11875 | -0.015 | 0.1786 | No | ||
| 60 | DNAJA1 | 1660010 2320358 6840136 | 12015 | -0.016 | 0.1721 | No | ||
| 61 | XPC | 6370193 | 12901 | -0.024 | 0.1259 | No | ||
| 62 | GDF15 | 4730017 | 13319 | -0.029 | 0.1053 | No | ||
| 63 | CITED2 | 5670114 5130088 | 13748 | -0.036 | 0.0845 | No | ||
| 64 | TAF7 | 6400504 6660601 | 13980 | -0.040 | 0.0746 | No | ||
| 65 | RAB21 | 5570070 | 14010 | -0.041 | 0.0757 | No | ||
| 66 | TAF9 | 1850458 3830136 | 15180 | -0.080 | 0.0178 | No | ||
| 67 | CLTA | 450010 | 15799 | -0.122 | -0.0078 | No | ||
| 68 | SON | 3120148 5860239 7040403 | 16165 | -0.158 | -0.0174 | No | ||
| 69 | NFKBIA | 1570152 | 16392 | -0.187 | -0.0177 | No | ||
| 70 | NEU1 | 380546 | 16770 | -0.238 | -0.0228 | No | ||
| 71 | ADM | 4810121 | 17148 | -0.301 | -0.0240 | No | ||
| 72 | RIT1 | 5390338 | 17404 | -0.352 | -0.0152 | No | ||
| 73 | QSCN6 | 3120441 | 17590 | -0.393 | -0.0001 | No | ||
| 74 | GSK3A | 3140735 | 17680 | -0.420 | 0.0219 | No | ||
| 75 | HMOX1 | 1740687 | 17758 | -0.447 | 0.0463 | No |