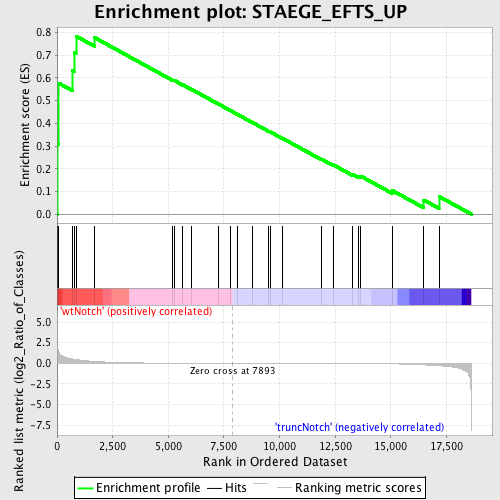
Profile of the Running ES Score & Positions of GeneSet Members on the Rank Ordered List
| Dataset | Set_03_wtNotch_versus_truncNotch.phenotype_wtNotch_versus_truncNotch.cls #wtNotch_versus_truncNotch.phenotype_wtNotch_versus_truncNotch.cls #wtNotch_versus_truncNotch_repos |
| Phenotype | phenotype_wtNotch_versus_truncNotch.cls#wtNotch_versus_truncNotch_repos |
| Upregulated in class | wtNotch |
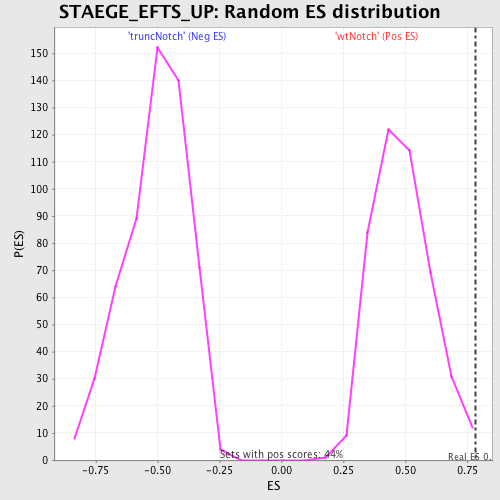
| GeneSet | STAEGE_EFTS_UP |
| Enrichment Score (ES) | 0.78441596 |
| Normalized Enrichment Score (NES) | 1.6137075 |
| Nominal p-value | 0.0022624435 |
| FDR q-value | 0.18926394 |
| FWER p-Value | 0.939 |
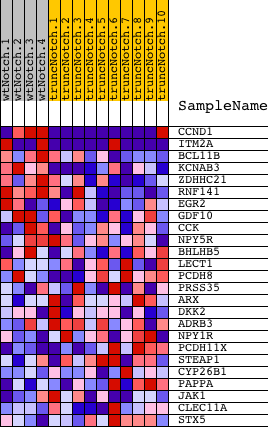
| PROBE | DESCRIPTION (from dataset) | GENE SYMBOL | GENE_TITLE | RANK IN GENE LIST | RANK METRIC SCORE | RUNNING ES | CORE ENRICHMENT | |
|---|---|---|---|---|---|---|---|---|
| 1 | CCND1 | 460524 770309 3120576 6980398 | 27 | 1.801 | 0.3099 | Yes | ||
| 2 | ITM2A | 460576 4210086 | 55 | 1.558 | 0.5779 | Yes | ||
| 3 | BCL11B | 2680673 | 697 | 0.514 | 0.6323 | Yes | ||
| 4 | KCNAB3 | 2470725 | 780 | 0.478 | 0.7105 | Yes | ||
| 5 | ZDHHC21 | 2370338 | 851 | 0.449 | 0.7844 | Yes | ||
| 6 | RNF141 | 130463 6840041 | 1678 | 0.221 | 0.7782 | No | ||
| 7 | EGR2 | 3800403 | 5194 | 0.011 | 0.5910 | No | ||
| 8 | GDF10 | 4850082 | 5270 | 0.011 | 0.5888 | No | ||
| 9 | CCK | 6370368 | 5651 | 0.008 | 0.5698 | No | ||
| 10 | NPY5R | 540451 | 6020 | 0.006 | 0.5511 | No | ||
| 11 | BHLHB5 | 6510520 | 7261 | 0.002 | 0.4847 | No | ||
| 12 | LECT1 | 2640528 | 7777 | 0.000 | 0.4571 | No | ||
| 13 | PCDH8 | 2360047 4200452 | 8098 | -0.001 | 0.4400 | No | ||
| 14 | PRSS35 | 3450725 | 8787 | -0.003 | 0.4034 | No | ||
| 15 | ARX | 6900504 | 9492 | -0.005 | 0.3663 | No | ||
| 16 | DKK2 | 3610433 | 9590 | -0.005 | 0.3619 | No | ||
| 17 | ADRB3 | 6900072 | 10146 | -0.007 | 0.3332 | No | ||
| 18 | NPY1R | 5890347 | 11886 | -0.015 | 0.2423 | No | ||
| 19 | PCDH11X | 540301 | 12408 | -0.019 | 0.2175 | No | ||
| 20 | STEAP1 | 4590575 | 13283 | -0.029 | 0.1754 | No | ||
| 21 | CYP26B1 | 2630142 | 13545 | -0.033 | 0.1670 | No | ||
| 22 | PAPPA | 4230463 | 13641 | -0.034 | 0.1679 | No | ||
| 23 | JAK1 | 5910746 | 15058 | -0.074 | 0.1045 | No | ||
| 24 | CLEC11A | 2680193 | 16483 | -0.198 | 0.0621 | No | ||
| 25 | STX5 | 3990193 | 17167 | -0.304 | 0.0779 | No |