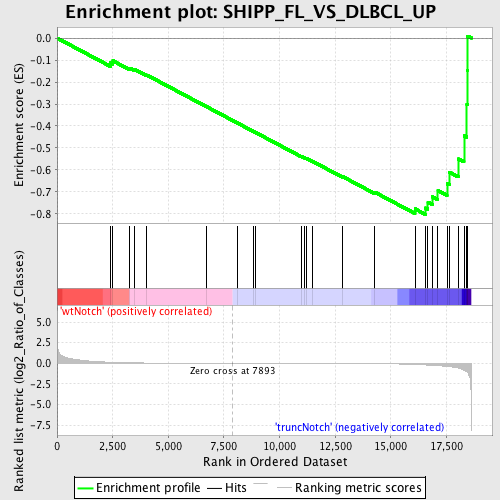
Profile of the Running ES Score & Positions of GeneSet Members on the Rank Ordered List
| Dataset | Set_03_wtNotch_versus_truncNotch.phenotype_wtNotch_versus_truncNotch.cls #wtNotch_versus_truncNotch.phenotype_wtNotch_versus_truncNotch.cls #wtNotch_versus_truncNotch_repos |
| Phenotype | phenotype_wtNotch_versus_truncNotch.cls#wtNotch_versus_truncNotch_repos |
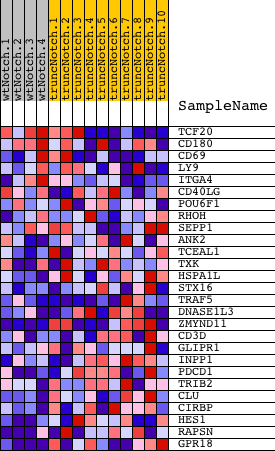
| Upregulated in class | truncNotch |
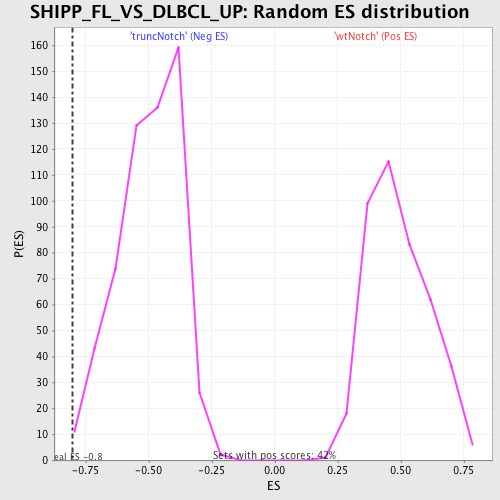
| GeneSet | SHIPP_FL_VS_DLBCL_UP |
| Enrichment Score (ES) | -0.8026466 |
| Normalized Enrichment Score (NES) | -1.6120718 |
| Nominal p-value | 0.005172414 |
| FDR q-value | 0.1927067 |
| FWER p-Value | 0.937 |
| PROBE | DESCRIPTION (from dataset) | GENE SYMBOL | GENE_TITLE | RANK IN GENE LIST | RANK METRIC SCORE | RUNNING ES | CORE ENRICHMENT | |
|---|---|---|---|---|---|---|---|---|
| 1 | TCF20 | 1190338 1240520 4070594 4810440 | 2394 | 0.117 | -0.1122 | No | ||
| 2 | CD180 | 360048 1410440 2850440 | 2510 | 0.105 | -0.1036 | No | ||
| 3 | CD69 | 380167 4730088 | 3256 | 0.052 | -0.1363 | No | ||
| 4 | LY9 | 3360315 4070292 | 3479 | 0.043 | -0.1421 | No | ||
| 5 | ITGA4 | 2470739 | 4029 | 0.026 | -0.1680 | No | ||
| 6 | CD40LG | 3120270 | 6724 | 0.003 | -0.3124 | No | ||
| 7 | POU6F1 | 6200168 | 8097 | -0.001 | -0.3861 | No | ||
| 8 | RHOH | 130184 | 8843 | -0.003 | -0.4258 | No | ||
| 9 | SEPP1 | 450273 | 8934 | -0.003 | -0.4302 | No | ||
| 10 | ANK2 | 6510546 | 10963 | -0.010 | -0.5379 | No | ||
| 11 | TCEAL1 | 870577 | 11106 | -0.011 | -0.5441 | No | ||
| 12 | TXK | 2320338 | 11201 | -0.011 | -0.5476 | No | ||
| 13 | HSPA1L | 4010538 | 11468 | -0.012 | -0.5601 | No | ||
| 14 | STX16 | 70315 | 12839 | -0.023 | -0.6305 | No | ||
| 15 | TRAF5 | 3290064 | 14281 | -0.047 | -0.7014 | No | ||
| 16 | DNASE1L3 | 670086 | 16087 | -0.150 | -0.7772 | Yes | ||
| 17 | ZMYND11 | 630181 2570019 4850138 5360040 | 16561 | -0.209 | -0.7730 | Yes | ||
| 18 | CD3D | 2810739 | 16670 | -0.222 | -0.7474 | Yes | ||
| 19 | GLIPR1 | 3360750 | 16876 | -0.255 | -0.7223 | Yes | ||
| 20 | INPP1 | 670368 | 17119 | -0.295 | -0.6935 | Yes | ||
| 21 | PDCD1 | 4120082 | 17528 | -0.375 | -0.6623 | Yes | ||
| 22 | TRIB2 | 4120605 | 17634 | -0.408 | -0.6100 | Yes | ||
| 23 | CLU | 5420075 | 18037 | -0.576 | -0.5500 | Yes | ||
| 24 | CIRBP | 1850408 | 18290 | -0.844 | -0.4439 | Yes | ||
| 25 | HES1 | 4810280 | 18420 | -1.054 | -0.3016 | Yes | ||
| 26 | RAPSN | 610110 2370162 | 18440 | -1.091 | -0.1479 | Yes | ||
| 27 | GPR18 | 2640551 | 18451 | -1.110 | 0.0089 | Yes |