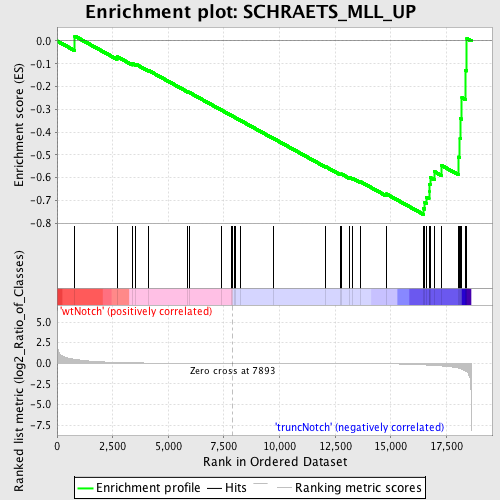
Profile of the Running ES Score & Positions of GeneSet Members on the Rank Ordered List
| Dataset | Set_03_wtNotch_versus_truncNotch.phenotype_wtNotch_versus_truncNotch.cls #wtNotch_versus_truncNotch.phenotype_wtNotch_versus_truncNotch.cls #wtNotch_versus_truncNotch_repos |
| Phenotype | phenotype_wtNotch_versus_truncNotch.cls#wtNotch_versus_truncNotch_repos |
| Upregulated in class | truncNotch |
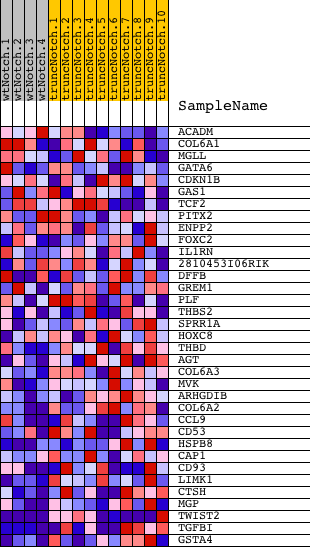
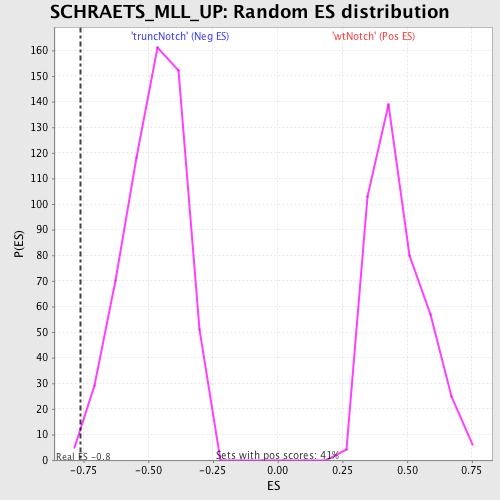
| GeneSet | SCHRAETS_MLL_UP |
| Enrichment Score (ES) | -0.7620981 |
| Normalized Enrichment Score (NES) | -1.594795 |
| Nominal p-value | 0.0085324235 |
| FDR q-value | 0.22982359 |
| FWER p-Value | 0.971 |
| PROBE | DESCRIPTION (from dataset) | GENE SYMBOL | GENE_TITLE | RANK IN GENE LIST | RANK METRIC SCORE | RUNNING ES | CORE ENRICHMENT | |
|---|---|---|---|---|---|---|---|---|
| 1 | ACADM | 460112 3390113 | 797 | 0.474 | 0.0213 | No | ||
| 2 | COL6A1 | 1410670 2940091 6510086 | 2693 | 0.090 | -0.0685 | No | ||
| 3 | MGLL | 2030446 4210520 | 3382 | 0.047 | -0.0992 | No | ||
| 4 | GATA6 | 1770010 | 3530 | 0.041 | -0.1016 | No | ||
| 5 | CDKN1B | 3800025 6450044 | 4101 | 0.024 | -0.1290 | No | ||
| 6 | GAS1 | 2120504 | 5882 | 0.007 | -0.2239 | No | ||
| 7 | TCF2 | 870338 5050632 | 5950 | 0.007 | -0.2266 | No | ||
| 8 | PITX2 | 870537 2690139 | 7394 | 0.001 | -0.3041 | No | ||
| 9 | ENPP2 | 5860546 | 7832 | 0.000 | -0.3276 | No | ||
| 10 | FOXC2 | 4150041 | 7882 | 0.000 | -0.3302 | No | ||
| 11 | IL1RN | 2370333 | 7976 | -0.000 | -0.3352 | No | ||
| 12 | 2810453I06RIK | 610132 4280593 5220139 | 7997 | -0.000 | -0.3362 | No | ||
| 13 | DFFB | 1770092 | 8233 | -0.001 | -0.3487 | No | ||
| 14 | GREM1 | 3940180 | 9711 | -0.005 | -0.4275 | No | ||
| 15 | PLF | 3830047 | 12072 | -0.016 | -0.5523 | No | ||
| 16 | THBS2 | 2850136 | 12748 | -0.022 | -0.5856 | No | ||
| 17 | SPRR1A | 3870064 | 12777 | -0.022 | -0.5841 | No | ||
| 18 | HOXC8 | 6220050 | 13139 | -0.027 | -0.5999 | No | ||
| 19 | THBD | 1500092 | 13263 | -0.028 | -0.6027 | No | ||
| 20 | AGT | 7000575 | 13628 | -0.034 | -0.6177 | No | ||
| 21 | COL6A3 | 2640717 4070064 5390717 | 14797 | -0.064 | -0.6719 | No | ||
| 22 | MVK | 1450717 | 16474 | -0.197 | -0.7355 | Yes | ||
| 23 | ARHGDIB | 4730433 | 16528 | -0.204 | -0.7107 | Yes | ||
| 24 | COL6A2 | 1780142 | 16593 | -0.213 | -0.6854 | Yes | ||
| 25 | CCL9 | 4610725 | 16717 | -0.231 | -0.6607 | Yes | ||
| 26 | CD53 | 5550162 | 16723 | -0.232 | -0.6295 | Yes | ||
| 27 | HSPB8 | 540563 | 16768 | -0.238 | -0.5997 | Yes | ||
| 28 | CAP1 | 2650278 | 16961 | -0.267 | -0.5738 | Yes | ||
| 29 | CD93 | 6770180 | 17269 | -0.325 | -0.5463 | Yes | ||
| 30 | LIMK1 | 5080064 | 18040 | -0.577 | -0.5096 | Yes | ||
| 31 | CTSH | 60524 | 18108 | -0.625 | -0.4285 | Yes | ||
| 32 | MGP | 6900736 | 18138 | -0.653 | -0.3417 | Yes | ||
| 33 | TWIST2 | 6760433 | 18195 | -0.701 | -0.2497 | Yes | ||
| 34 | TGFBI | 2060446 6900112 | 18366 | -0.957 | -0.1291 | Yes | ||
| 35 | GSTA4 | 1660369 | 18419 | -1.052 | 0.0106 | Yes |