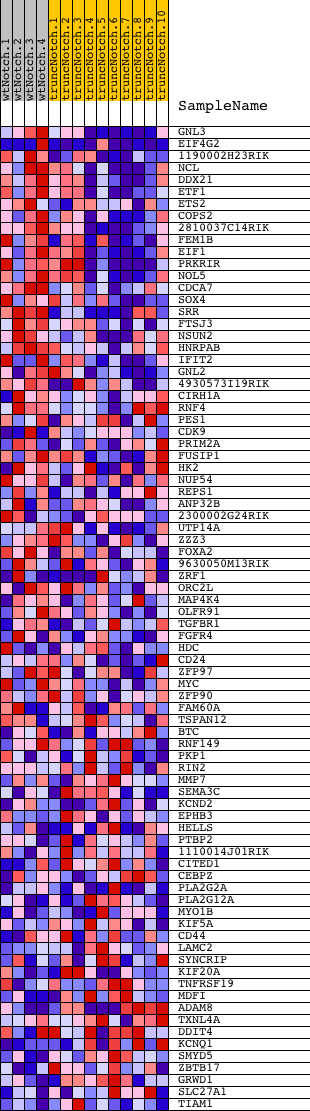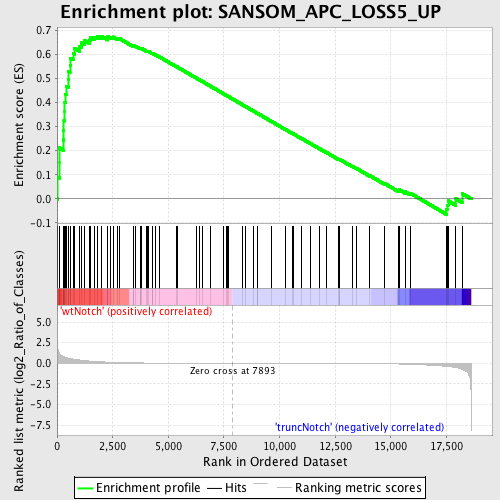
Profile of the Running ES Score & Positions of GeneSet Members on the Rank Ordered List
| Dataset | Set_03_wtNotch_versus_truncNotch.phenotype_wtNotch_versus_truncNotch.cls #wtNotch_versus_truncNotch.phenotype_wtNotch_versus_truncNotch.cls #wtNotch_versus_truncNotch_repos |
| Phenotype | phenotype_wtNotch_versus_truncNotch.cls#wtNotch_versus_truncNotch_repos |
| Upregulated in class | wtNotch |
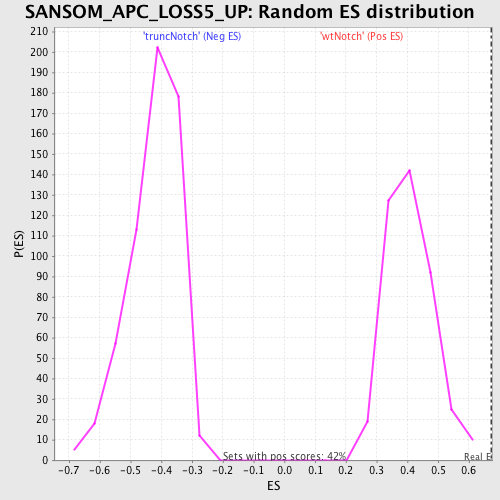
| GeneSet | SANSOM_APC_LOSS5_UP |
| Enrichment Score (ES) | 0.67536545 |
| Normalized Enrichment Score (NES) | 1.6597469 |
| Nominal p-value | 0.0 |
| FDR q-value | 0.15917596 |
| FWER p-Value | 0.731 |
| PROBE | DESCRIPTION (from dataset) | GENE SYMBOL | GENE_TITLE | RANK IN GENE LIST | RANK METRIC SCORE | RUNNING ES | CORE ENRICHMENT | |
|---|---|---|---|---|---|---|---|---|
| 1 | GNL3 | 4050338 4810500 | 36 | 1.738 | 0.0894 | Yes | ||
| 2 | EIF4G2 | 3800575 6860184 | 94 | 1.204 | 0.1495 | Yes | ||
| 3 | 1190002H23RIK | 4480128 | 96 | 1.185 | 0.2117 | Yes | ||
| 4 | NCL | 2360463 4540279 | 275 | 0.807 | 0.2445 | Yes | ||
| 5 | DDX21 | 6100446 | 292 | 0.788 | 0.2850 | Yes | ||
| 6 | ETF1 | 6770075 | 307 | 0.780 | 0.3252 | Yes | ||
| 7 | ETS2 | 360451 | 348 | 0.742 | 0.3620 | Yes | ||
| 8 | COPS2 | 3060142 | 351 | 0.735 | 0.4005 | Yes | ||
| 9 | 2810037C14RIK | 5290575 | 388 | 0.697 | 0.4351 | Yes | ||
| 10 | FEM1B | 1230110 | 435 | 0.659 | 0.4672 | Yes | ||
| 11 | EIF1 | 5080100 | 498 | 0.622 | 0.4966 | Yes | ||
| 12 | PRKRIR | 2370402 | 505 | 0.619 | 0.5288 | Yes | ||
| 13 | NOL5 | 580731 | 581 | 0.574 | 0.5549 | Yes | ||
| 14 | CDCA7 | 3060097 | 613 | 0.558 | 0.5825 | Yes | ||
| 15 | SOX4 | 2260091 | 720 | 0.506 | 0.6034 | Yes | ||
| 16 | SRR | 1190465 3800494 | 792 | 0.475 | 0.6245 | Yes | ||
| 17 | FTSJ3 | 3140100 | 1016 | 0.388 | 0.6328 | Yes | ||
| 18 | NSUN2 | 2120193 | 1102 | 0.358 | 0.6470 | Yes | ||
| 19 | HNRPAB | 540504 | 1226 | 0.328 | 0.6576 | Yes | ||
| 20 | IFIT2 | 4810735 | 1453 | 0.266 | 0.6594 | Yes | ||
| 21 | GNL2 | 6620022 | 1492 | 0.257 | 0.6709 | Yes | ||
| 22 | 4930573I19RIK | 5270402 | 1700 | 0.217 | 0.6711 | Yes | ||
| 23 | CIRH1A | 2340372 | 1813 | 0.196 | 0.6754 | Yes | ||
| 24 | RNF4 | 580286 1400152 | 1988 | 0.170 | 0.6749 | No | ||
| 25 | PES1 | 2470427 | 2279 | 0.129 | 0.6660 | No | ||
| 26 | CDK9 | 630707 | 2283 | 0.128 | 0.6726 | No | ||
| 27 | PRIM2A | 7000692 | 2415 | 0.114 | 0.6715 | No | ||
| 28 | FUSIP1 | 520082 5390114 | 2513 | 0.105 | 0.6718 | No | ||
| 29 | HK2 | 2640722 | 2725 | 0.087 | 0.6650 | No | ||
| 30 | NUP54 | 940546 2360156 4060278 | 2784 | 0.084 | 0.6662 | No | ||
| 31 | REPS1 | 2320603 2510333 | 3426 | 0.045 | 0.6340 | No | ||
| 32 | ANP32B | 940095 2450494 4200368 | 3431 | 0.045 | 0.6361 | No | ||
| 33 | 2300002G24RIK | 2320040 | 3523 | 0.041 | 0.6334 | No | ||
| 34 | UTP14A | 6590048 | 3730 | 0.034 | 0.6240 | No | ||
| 35 | ZZZ3 | 780133 2320239 2640452 5080706 6550341 | 3738 | 0.033 | 0.6254 | No | ||
| 36 | FOXA2 | 540338 5860441 | 3804 | 0.032 | 0.6236 | No | ||
| 37 | 9630050M13RIK | 2370086 | 4027 | 0.026 | 0.6129 | No | ||
| 38 | ZRF1 | 6020181 6510484 | 4070 | 0.025 | 0.6120 | No | ||
| 39 | ORC2L | 1990470 6510019 | 4085 | 0.025 | 0.6125 | No | ||
| 40 | MAP4K4 | 2360059 | 4283 | 0.021 | 0.6030 | No | ||
| 41 | OLFR91 | 6290020 | 4296 | 0.021 | 0.6035 | No | ||
| 42 | TGFBR1 | 1400148 4280020 6550711 | 4443 | 0.019 | 0.5966 | No | ||
| 43 | FGFR4 | 2650072 | 4585 | 0.017 | 0.5899 | No | ||
| 44 | HDC | 4150463 | 5344 | 0.010 | 0.5495 | No | ||
| 45 | CD24 | 1780091 | 5389 | 0.010 | 0.5477 | No | ||
| 46 | ZFP97 | 520324 | 6248 | 0.005 | 0.5016 | No | ||
| 47 | MYC | 380541 4670170 | 6391 | 0.005 | 0.4942 | No | ||
| 48 | ZFP90 | 580121 | 6529 | 0.004 | 0.4871 | No | ||
| 49 | FAM60A | 3940092 | 6915 | 0.003 | 0.4664 | No | ||
| 50 | TSPAN12 | 4120010 | 7461 | 0.001 | 0.4371 | No | ||
| 51 | BTC | 3190133 | 7624 | 0.001 | 0.4284 | No | ||
| 52 | RNF149 | 5270494 | 7642 | 0.001 | 0.4275 | No | ||
| 53 | PKP1 | 1500433 | 7698 | 0.001 | 0.4246 | No | ||
| 54 | RIN2 | 2450184 | 8318 | -0.001 | 0.3912 | No | ||
| 55 | MMP7 | 1780497 | 8489 | -0.002 | 0.3822 | No | ||
| 56 | SEMA3C | 7000020 | 8842 | -0.003 | 0.3633 | No | ||
| 57 | KCND2 | 1170128 2100112 | 9005 | -0.003 | 0.3547 | No | ||
| 58 | EPHB3 | 6650341 | 9017 | -0.003 | 0.3543 | No | ||
| 59 | HELLS | 4560086 4810025 | 9638 | -0.005 | 0.3211 | No | ||
| 60 | PTBP2 | 1240398 | 10262 | -0.007 | 0.2879 | No | ||
| 61 | 1110014J01RIK | 1980332 | 10587 | -0.008 | 0.2708 | No | ||
| 62 | CITED1 | 2350670 | 10608 | -0.008 | 0.2702 | No | ||
| 63 | CEBPZ | 2970053 2680068 | 11001 | -0.010 | 0.2496 | No | ||
| 64 | PLA2G2A | 3190458 | 11390 | -0.012 | 0.2293 | No | ||
| 65 | PLA2G12A | 1740463 4010066 4050348 | 11810 | -0.014 | 0.2074 | No | ||
| 66 | MYO1B | 770372 | 12117 | -0.016 | 0.1918 | No | ||
| 67 | KIF5A | 510435 | 12639 | -0.021 | 0.1648 | No | ||
| 68 | CD44 | 3990072 4850671 5860411 6860148 7050551 | 12698 | -0.022 | 0.1628 | No | ||
| 69 | LAMC2 | 450692 2680041 4200059 4670148 | 12714 | -0.022 | 0.1631 | No | ||
| 70 | SYNCRIP | 1690195 3140113 4670279 | 13266 | -0.028 | 0.1349 | No | ||
| 71 | KIF20A | 2650050 | 13448 | -0.031 | 0.1267 | No | ||
| 72 | TNFRSF19 | 3870731 6940730 | 14049 | -0.042 | 0.0966 | No | ||
| 73 | MDFI | 6200041 | 14728 | -0.061 | 0.0632 | No | ||
| 74 | ADAM8 | 450347 5670609 | 15357 | -0.090 | 0.0341 | No | ||
| 75 | TXNL4A | 4120286 6510242 | 15384 | -0.092 | 0.0375 | No | ||
| 76 | DDIT4 | 2570408 | 15645 | -0.108 | 0.0291 | No | ||
| 77 | KCNQ1 | 1580050 6860441 | 15863 | -0.128 | 0.0241 | No | ||
| 78 | SMYD5 | 6220025 | 17514 | -0.373 | -0.0453 | No | ||
| 79 | ZBTB17 | 6220082 | 17533 | -0.376 | -0.0265 | No | ||
| 80 | GRWD1 | 6350528 | 17573 | -0.387 | -0.0083 | No | ||
| 81 | SLC27A1 | 6110093 | 17924 | -0.512 | -0.0002 | No | ||
| 82 | TIAM1 | 5420288 | 18204 | -0.714 | 0.0222 | No |