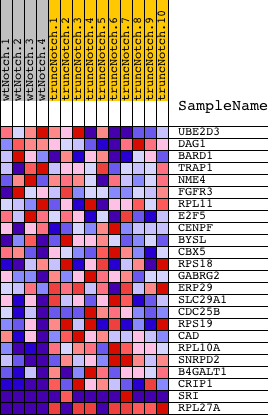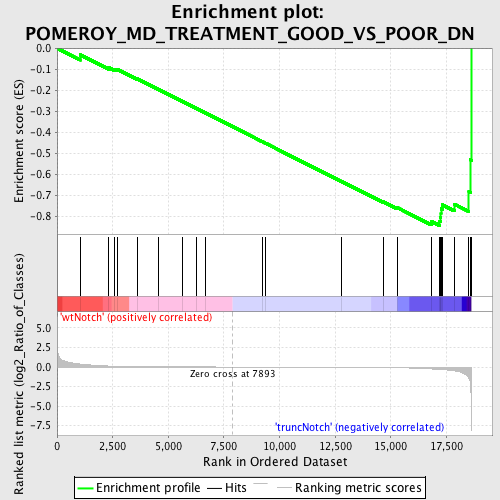
Profile of the Running ES Score & Positions of GeneSet Members on the Rank Ordered List
| Dataset | Set_03_wtNotch_versus_truncNotch.phenotype_wtNotch_versus_truncNotch.cls #wtNotch_versus_truncNotch.phenotype_wtNotch_versus_truncNotch.cls #wtNotch_versus_truncNotch_repos |
| Phenotype | phenotype_wtNotch_versus_truncNotch.cls#wtNotch_versus_truncNotch_repos |
| Upregulated in class | truncNotch |
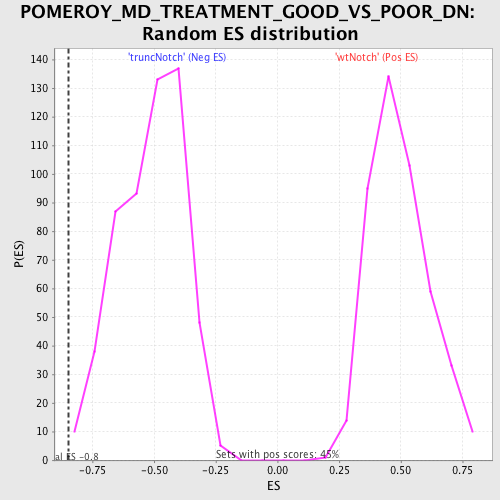
| GeneSet | POMEROY_MD_TREATMENT_GOOD_VS_POOR_DN |
| Enrichment Score (ES) | -0.84527445 |
| Normalized Enrichment Score (NES) | -1.6499226 |
| Nominal p-value | 0.001814882 |
| FDR q-value | 0.21955313 |
| FWER p-Value | 0.695 |
| PROBE | DESCRIPTION (from dataset) | GENE SYMBOL | GENE_TITLE | RANK IN GENE LIST | RANK METRIC SCORE | RUNNING ES | CORE ENRICHMENT | |
|---|---|---|---|---|---|---|---|---|
| 1 | UBE2D3 | 3190452 | 1032 | 0.381 | -0.0305 | No | ||
| 2 | DAG1 | 460053 610341 | 2316 | 0.125 | -0.0912 | No | ||
| 3 | BARD1 | 3170348 | 2578 | 0.100 | -0.0987 | No | ||
| 4 | TRAP1 | 6040168 | 2705 | 0.089 | -0.0997 | No | ||
| 5 | NME4 | 3140736 5900446 | 3595 | 0.038 | -0.1450 | No | ||
| 6 | FGFR3 | 5390632 6020021 | 4553 | 0.017 | -0.1953 | No | ||
| 7 | RPL11 | 3780435 | 5655 | 0.008 | -0.2540 | No | ||
| 8 | E2F5 | 5860575 | 6266 | 0.005 | -0.2865 | No | ||
| 9 | CENPF | 5050088 | 6674 | 0.004 | -0.3081 | No | ||
| 10 | BYSL | 3170110 | 9216 | -0.004 | -0.4445 | No | ||
| 11 | CBX5 | 3830072 6290167 | 9355 | -0.004 | -0.4517 | No | ||
| 12 | RPS18 | 670132 1230148 2030722 | 12794 | -0.023 | -0.6351 | No | ||
| 13 | GABRG2 | 2350402 4210204 6130279 6550037 | 14662 | -0.059 | -0.7316 | No | ||
| 14 | ERP29 | 4050441 | 15297 | -0.087 | -0.7600 | No | ||
| 15 | SLC29A1 | 2970379 | 16827 | -0.248 | -0.8259 | Yes | ||
| 16 | CDC25B | 6940102 | 17188 | -0.308 | -0.8250 | Yes | ||
| 17 | RPS19 | 5860066 | 17227 | -0.317 | -0.8062 | Yes | ||
| 18 | CAD | 2340717 | 17254 | -0.323 | -0.7863 | Yes | ||
| 19 | RPL10A | 4850066 | 17257 | -0.324 | -0.7651 | Yes | ||
| 20 | SNRPD2 | 6110035 | 17309 | -0.333 | -0.7459 | Yes | ||
| 21 | B4GALT1 | 6980167 | 17863 | -0.488 | -0.7435 | Yes | ||
| 22 | CRIP1 | 4590377 | 18510 | -1.431 | -0.6841 | Yes | ||
| 23 | SRI | 3390446 4850064 | 18582 | -2.378 | -0.5314 | Yes | ||
| 24 | RPL27A | 3130451 110195 6840494 | 18616 | -8.101 | -0.0000 | Yes |