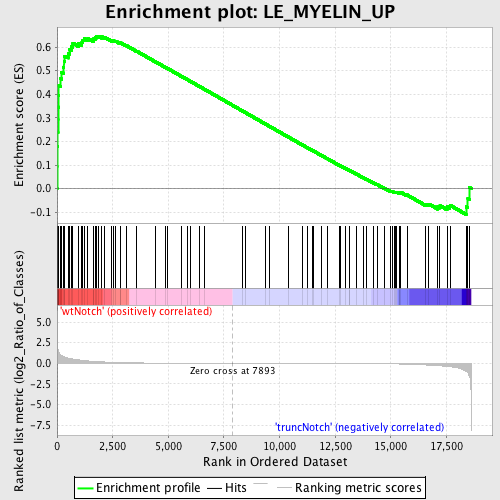
Profile of the Running ES Score & Positions of GeneSet Members on the Rank Ordered List
| Dataset | Set_03_wtNotch_versus_truncNotch.phenotype_wtNotch_versus_truncNotch.cls #wtNotch_versus_truncNotch.phenotype_wtNotch_versus_truncNotch.cls #wtNotch_versus_truncNotch_repos |
| Phenotype | phenotype_wtNotch_versus_truncNotch.cls#wtNotch_versus_truncNotch_repos |
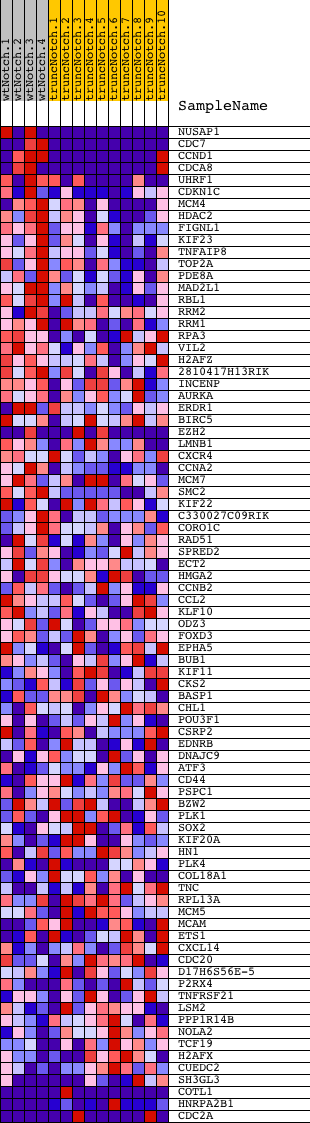
| Upregulated in class | wtNotch |
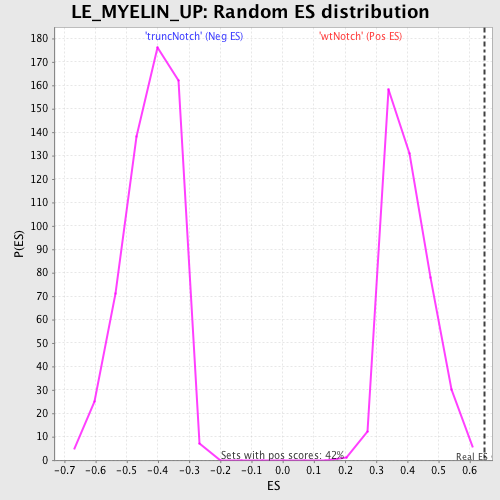
| GeneSet | LE_MYELIN_UP |
| Enrichment Score (ES) | 0.6466451 |
| Normalized Enrichment Score (NES) | 1.6123626 |
| Nominal p-value | 0.0 |
| FDR q-value | 0.18258175 |
| FWER p-Value | 0.944 |
| PROBE | DESCRIPTION (from dataset) | GENE SYMBOL | GENE_TITLE | RANK IN GENE LIST | RANK METRIC SCORE | RUNNING ES | CORE ENRICHMENT | |
|---|---|---|---|---|---|---|---|---|
| 1 | NUSAP1 | 940048 3120435 | 5 | 2.829 | 0.0923 | Yes | ||
| 2 | CDC7 | 4060546 4850041 | 7 | 2.689 | 0.1802 | Yes | ||
| 3 | CCND1 | 460524 770309 3120576 6980398 | 27 | 1.801 | 0.2381 | Yes | ||
| 4 | CDCA8 | 2340286 6980019 | 41 | 1.667 | 0.2920 | Yes | ||
| 5 | UHRF1 | 1410273 1660242 | 43 | 1.658 | 0.3461 | Yes | ||
| 6 | CDKN1C | 6520577 | 59 | 1.527 | 0.3953 | Yes | ||
| 7 | MCM4 | 2760673 5420711 | 78 | 1.324 | 0.4376 | Yes | ||
| 8 | HDAC2 | 4050433 | 161 | 0.999 | 0.4659 | Yes | ||
| 9 | FIGNL1 | 6860390 | 200 | 0.914 | 0.4938 | Yes | ||
| 10 | KIF23 | 5570112 | 288 | 0.792 | 0.5150 | Yes | ||
| 11 | TNFAIP8 | 2760551 | 309 | 0.778 | 0.5394 | Yes | ||
| 12 | TOP2A | 360717 | 340 | 0.748 | 0.5622 | Yes | ||
| 13 | PDE8A | 5080446 | 496 | 0.624 | 0.5743 | Yes | ||
| 14 | MAD2L1 | 4480725 | 569 | 0.583 | 0.5895 | Yes | ||
| 15 | RBL1 | 3130372 | 638 | 0.543 | 0.6035 | Yes | ||
| 16 | RRM2 | 6350059 6940162 | 707 | 0.510 | 0.6166 | Yes | ||
| 17 | RRM1 | 4150433 | 972 | 0.408 | 0.6157 | Yes | ||
| 18 | RPA3 | 5700136 | 1113 | 0.356 | 0.6197 | Yes | ||
| 19 | VIL2 | 5570161 | 1153 | 0.347 | 0.6290 | Yes | ||
| 20 | H2AFZ | 1470168 | 1209 | 0.332 | 0.6369 | Yes | ||
| 21 | 2810417H13RIK | 4850091 | 1383 | 0.283 | 0.6368 | Yes | ||
| 22 | INCENP | 520593 | 1630 | 0.229 | 0.6310 | Yes | ||
| 23 | AURKA | 780537 | 1652 | 0.225 | 0.6373 | Yes | ||
| 24 | ERDR1 | 5890184 6370142 | 1716 | 0.215 | 0.6409 | Yes | ||
| 25 | BIRC5 | 110408 580014 1770632 | 1761 | 0.207 | 0.6453 | Yes | ||
| 26 | EZH2 | 6130605 6380524 | 1852 | 0.189 | 0.6466 | Yes | ||
| 27 | LMNB1 | 5890292 6020008 | 2007 | 0.167 | 0.6438 | No | ||
| 28 | CXCR4 | 4590519 | 2146 | 0.146 | 0.6411 | No | ||
| 29 | CCNA2 | 5290075 | 2458 | 0.110 | 0.6280 | No | ||
| 30 | MCM7 | 3290292 5220056 | 2530 | 0.103 | 0.6275 | No | ||
| 31 | SMC2 | 4810133 | 2629 | 0.095 | 0.6253 | No | ||
| 32 | KIF22 | 1190368 | 2840 | 0.079 | 0.6166 | No | ||
| 33 | C330027C09RIK | 2680450 2680685 | 2864 | 0.077 | 0.6179 | No | ||
| 34 | CORO1C | 4570397 | 3112 | 0.061 | 0.6065 | No | ||
| 35 | RAD51 | 6110450 6980280 | 3584 | 0.039 | 0.5824 | No | ||
| 36 | SPRED2 | 510138 540195 | 4430 | 0.019 | 0.5374 | No | ||
| 37 | ECT2 | 3830086 | 4860 | 0.014 | 0.5147 | No | ||
| 38 | HMGA2 | 2940121 3390647 5130279 6400136 | 4964 | 0.013 | 0.5096 | No | ||
| 39 | CCNB2 | 6510528 | 5583 | 0.009 | 0.4765 | No | ||
| 40 | CCL2 | 4760019 | 5845 | 0.007 | 0.4627 | No | ||
| 41 | KLF10 | 4850056 | 5990 | 0.006 | 0.4551 | No | ||
| 42 | ODZ3 | 3060725 6450292 | 6390 | 0.005 | 0.4337 | No | ||
| 43 | FOXD3 | 6550156 | 6611 | 0.004 | 0.4220 | No | ||
| 44 | EPHA5 | 2340671 | 8339 | -0.001 | 0.3289 | No | ||
| 45 | BUB1 | 5390270 | 8455 | -0.002 | 0.3227 | No | ||
| 46 | KIF11 | 5390139 | 9366 | -0.004 | 0.2737 | No | ||
| 47 | CKS2 | 1410156 | 9543 | -0.005 | 0.2644 | No | ||
| 48 | BASP1 | 5700044 | 10392 | -0.008 | 0.2189 | No | ||
| 49 | CHL1 | 50072 1500021 1580286 6660524 | 11019 | -0.010 | 0.1854 | No | ||
| 50 | POU3F1 | 3710022 | 11264 | -0.011 | 0.1727 | No | ||
| 51 | CSRP2 | 1030575 | 11488 | -0.012 | 0.1610 | No | ||
| 52 | EDNRB | 4280717 6400435 | 11532 | -0.013 | 0.1591 | No | ||
| 53 | DNAJC9 | 6130019 | 11862 | -0.015 | 0.1419 | No | ||
| 54 | ATF3 | 1940546 | 12131 | -0.017 | 0.1279 | No | ||
| 55 | CD44 | 3990072 4850671 5860411 6860148 7050551 | 12698 | -0.022 | 0.0981 | No | ||
| 56 | PSPC1 | 1660017 | 12732 | -0.022 | 0.0970 | No | ||
| 57 | BZW2 | 940079 | 12976 | -0.025 | 0.0847 | No | ||
| 58 | PLK1 | 1780369 2640121 | 13157 | -0.027 | 0.0759 | No | ||
| 59 | SOX2 | 630487 2230491 | 13164 | -0.027 | 0.0765 | No | ||
| 60 | KIF20A | 2650050 | 13448 | -0.031 | 0.0622 | No | ||
| 61 | HN1 | 3360156 | 13757 | -0.036 | 0.0468 | No | ||
| 62 | PLK4 | 430162 5720110 | 13915 | -0.039 | 0.0396 | No | ||
| 63 | COL18A1 | 610301 4570338 | 14211 | -0.046 | 0.0252 | No | ||
| 64 | TNC | 670053 1780039 1980020 3060411 4780091 6860433 | 14382 | -0.050 | 0.0177 | No | ||
| 65 | RPL13A | 2680519 5700142 | 14699 | -0.060 | 0.0026 | No | ||
| 66 | MCM5 | 2680647 | 14988 | -0.071 | -0.0107 | No | ||
| 67 | MCAM | 5130270 6620577 | 15055 | -0.074 | -0.0118 | No | ||
| 68 | ETS1 | 5270278 6450717 6620465 | 15170 | -0.079 | -0.0154 | No | ||
| 69 | CXCL14 | 840114 6450324 | 15221 | -0.082 | -0.0154 | No | ||
| 70 | CDC20 | 3440017 3440044 6220088 | 15274 | -0.085 | -0.0154 | No | ||
| 71 | D17H6S56E-5 | 4760095 | 15382 | -0.092 | -0.0182 | No | ||
| 72 | P2RX4 | 2060497 6650162 | 15408 | -0.094 | -0.0164 | No | ||
| 73 | TNFRSF21 | 6380100 | 15441 | -0.096 | -0.0150 | No | ||
| 74 | LSM2 | 510082 | 15728 | -0.115 | -0.0267 | No | ||
| 75 | PPP1R14B | 3800075 | 16580 | -0.211 | -0.0657 | No | ||
| 76 | NOLA2 | 4060167 | 16713 | -0.230 | -0.0653 | No | ||
| 77 | TCF19 | 6200152 | 17112 | -0.293 | -0.0772 | No | ||
| 78 | H2AFX | 3520082 | 17209 | -0.313 | -0.0721 | No | ||
| 79 | CUEDC2 | 460095 | 17529 | -0.375 | -0.0770 | No | ||
| 80 | SH3GL3 | 3800112 | 17659 | -0.416 | -0.0704 | No | ||
| 81 | COTL1 | 3840050 6350215 | 18388 | -0.991 | -0.0772 | No | ||
| 82 | HNRPA2B1 | 1240619 6200161 6200494 6980408 | 18464 | -1.154 | -0.0435 | No | ||
| 83 | CDC2A | 1570411 3800450 | 18538 | -1.579 | 0.0042 | No |