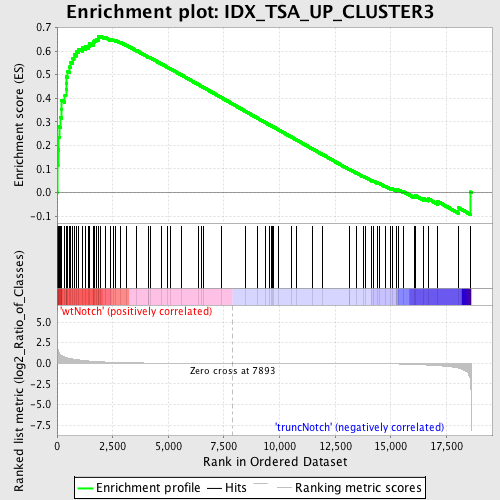
Profile of the Running ES Score & Positions of GeneSet Members on the Rank Ordered List
| Dataset | Set_03_wtNotch_versus_truncNotch.phenotype_wtNotch_versus_truncNotch.cls #wtNotch_versus_truncNotch.phenotype_wtNotch_versus_truncNotch.cls #wtNotch_versus_truncNotch_repos |
| Phenotype | phenotype_wtNotch_versus_truncNotch.cls#wtNotch_versus_truncNotch_repos |
| Upregulated in class | wtNotch |
| GeneSet | IDX_TSA_UP_CLUSTER3 |
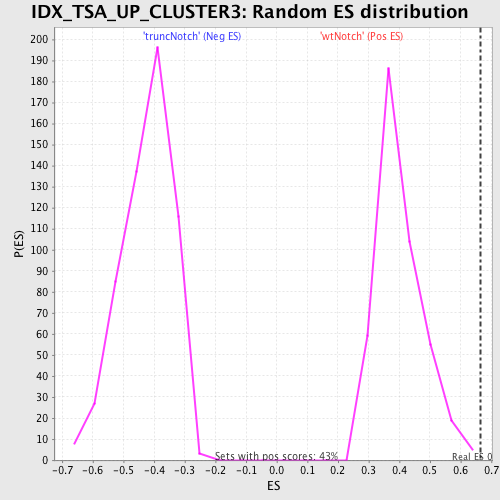
| Enrichment Score (ES) | 0.66366833 |
| Normalized Enrichment Score (NES) | 1.6530584 |
| Nominal p-value | 0.004672897 |
| FDR q-value | 0.13422935 |
| FWER p-Value | 0.766 |
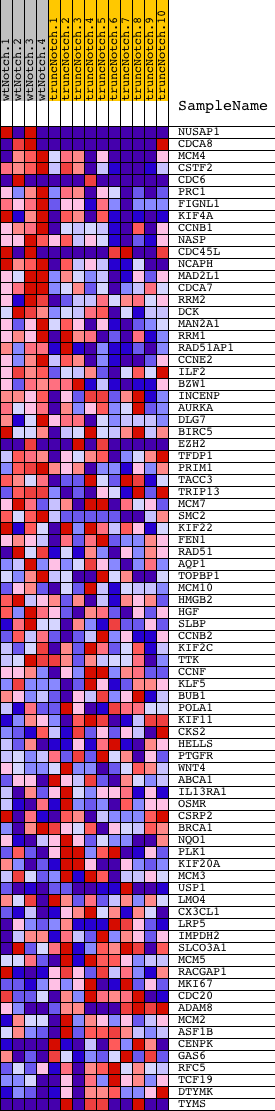
| PROBE | DESCRIPTION (from dataset) | GENE SYMBOL | GENE_TITLE | RANK IN GENE LIST | RANK METRIC SCORE | RUNNING ES | CORE ENRICHMENT | |
|---|---|---|---|---|---|---|---|---|
| 1 | NUSAP1 | 940048 3120435 | 5 | 2.829 | 0.1147 | Yes | ||
| 2 | CDCA8 | 2340286 6980019 | 41 | 1.667 | 0.1806 | Yes | ||
| 3 | MCM4 | 2760673 5420711 | 78 | 1.324 | 0.2325 | Yes | ||
| 4 | CSTF2 | 6040463 | 101 | 1.162 | 0.2785 | Yes | ||
| 5 | CDC6 | 4570296 5360600 | 145 | 1.030 | 0.3181 | Yes | ||
| 6 | PRC1 | 870092 5890204 | 190 | 0.927 | 0.3534 | Yes | ||
| 7 | FIGNL1 | 6860390 | 200 | 0.914 | 0.3901 | Yes | ||
| 8 | KIF4A | 1410465 4760070 | 349 | 0.741 | 0.4122 | Yes | ||
| 9 | CCNB1 | 4590433 4780372 | 400 | 0.685 | 0.4374 | Yes | ||
| 10 | NASP | 2260139 2940369 5130707 | 411 | 0.676 | 0.4643 | Yes | ||
| 11 | CDC45L | 70537 3130114 | 423 | 0.667 | 0.4908 | Yes | ||
| 12 | NCAPH | 6220435 | 476 | 0.637 | 0.5139 | Yes | ||
| 13 | MAD2L1 | 4480725 | 569 | 0.583 | 0.5327 | Yes | ||
| 14 | CDCA7 | 3060097 | 613 | 0.558 | 0.5530 | Yes | ||
| 15 | RRM2 | 6350059 6940162 | 707 | 0.510 | 0.5688 | Yes | ||
| 16 | DCK | 6900411 | 760 | 0.485 | 0.5857 | Yes | ||
| 17 | MAN2A1 | 6650176 | 882 | 0.438 | 0.5970 | Yes | ||
| 18 | RRM1 | 4150433 | 972 | 0.408 | 0.6087 | Yes | ||
| 19 | RAD51AP1 | 4050736 6370528 | 1145 | 0.349 | 0.6137 | Yes | ||
| 20 | CCNE2 | 3120537 | 1281 | 0.315 | 0.6192 | Yes | ||
| 21 | ILF2 | 2900253 | 1432 | 0.270 | 0.6221 | Yes | ||
| 22 | BZW1 | 460270 | 1458 | 0.265 | 0.6315 | Yes | ||
| 23 | INCENP | 520593 | 1630 | 0.229 | 0.6316 | Yes | ||
| 24 | AURKA | 780537 | 1652 | 0.225 | 0.6396 | Yes | ||
| 25 | DLG7 | 3120041 | 1681 | 0.220 | 0.6471 | Yes | ||
| 26 | BIRC5 | 110408 580014 1770632 | 1761 | 0.207 | 0.6512 | Yes | ||
| 27 | EZH2 | 6130605 6380524 | 1852 | 0.189 | 0.6540 | Yes | ||
| 28 | TFDP1 | 1980112 | 1860 | 0.187 | 0.6613 | Yes | ||
| 29 | PRIM1 | 6420746 | 1949 | 0.175 | 0.6637 | Yes | ||
| 30 | TACC3 | 5130592 | 2157 | 0.144 | 0.6584 | No | ||
| 31 | TRIP13 | 6860341 | 2414 | 0.115 | 0.6492 | No | ||
| 32 | MCM7 | 3290292 5220056 | 2530 | 0.103 | 0.6472 | No | ||
| 33 | SMC2 | 4810133 | 2629 | 0.095 | 0.6458 | No | ||
| 34 | KIF22 | 1190368 | 2840 | 0.079 | 0.6377 | No | ||
| 35 | FEN1 | 1770541 | 3133 | 0.059 | 0.6243 | No | ||
| 36 | RAD51 | 6110450 6980280 | 3584 | 0.039 | 0.6016 | No | ||
| 37 | AQP1 | 450338 6020292 | 4113 | 0.024 | 0.5741 | No | ||
| 38 | TOPBP1 | 6020333 | 4125 | 0.024 | 0.5745 | No | ||
| 39 | MCM10 | 4920632 | 4179 | 0.023 | 0.5725 | No | ||
| 40 | HMGB2 | 2640603 | 4698 | 0.016 | 0.5452 | No | ||
| 41 | HGF | 3360593 | 4975 | 0.013 | 0.5309 | No | ||
| 42 | SLBP | 6220601 | 5090 | 0.012 | 0.5252 | No | ||
| 43 | CCNB2 | 6510528 | 5583 | 0.009 | 0.4990 | No | ||
| 44 | KIF2C | 6940082 | 6353 | 0.005 | 0.4577 | No | ||
| 45 | TTK | 3800129 | 6474 | 0.004 | 0.4514 | No | ||
| 46 | CCNF | 6370288 | 6566 | 0.004 | 0.4467 | No | ||
| 47 | KLF5 | 3840348 | 7369 | 0.001 | 0.4035 | No | ||
| 48 | BUB1 | 5390270 | 8455 | -0.002 | 0.3450 | No | ||
| 49 | POLA1 | 4760541 | 9003 | -0.003 | 0.3156 | No | ||
| 50 | KIF11 | 5390139 | 9366 | -0.004 | 0.2962 | No | ||
| 51 | CKS2 | 1410156 | 9543 | -0.005 | 0.2869 | No | ||
| 52 | HELLS | 4560086 4810025 | 9638 | -0.005 | 0.2821 | No | ||
| 53 | PTGFR | 3850373 | 9661 | -0.005 | 0.2811 | No | ||
| 54 | WNT4 | 4150619 | 9743 | -0.005 | 0.2769 | No | ||
| 55 | ABCA1 | 6290156 | 9947 | -0.006 | 0.2662 | No | ||
| 56 | IL13RA1 | 5550609 | 10541 | -0.008 | 0.2346 | No | ||
| 57 | OSMR | 1990519 | 10768 | -0.009 | 0.2227 | No | ||
| 58 | CSRP2 | 1030575 | 11488 | -0.012 | 0.1845 | No | ||
| 59 | BRCA1 | 4780669 | 11937 | -0.015 | 0.1609 | No | ||
| 60 | NQO1 | 3450136 6840121 | 13130 | -0.027 | 0.0977 | No | ||
| 61 | PLK1 | 1780369 2640121 | 13157 | -0.027 | 0.0974 | No | ||
| 62 | KIF20A | 2650050 | 13448 | -0.031 | 0.0830 | No | ||
| 63 | MCM3 | 5570068 | 13752 | -0.036 | 0.0681 | No | ||
| 64 | USP1 | 2760541 5690438 6220673 | 13860 | -0.038 | 0.0639 | No | ||
| 65 | LMO4 | 3800746 | 14148 | -0.045 | 0.0502 | No | ||
| 66 | CX3CL1 | 3990707 | 14222 | -0.046 | 0.0482 | No | ||
| 67 | LRP5 | 2100397 3170484 | 14383 | -0.050 | 0.0416 | No | ||
| 68 | IMPDH2 | 5220138 | 14487 | -0.053 | 0.0382 | No | ||
| 69 | SLCO3A1 | 1050408 2370156 6110072 | 14744 | -0.061 | 0.0269 | No | ||
| 70 | MCM5 | 2680647 | 14988 | -0.071 | 0.0166 | No | ||
| 71 | RACGAP1 | 3990162 6620736 | 15053 | -0.074 | 0.0162 | No | ||
| 72 | MKI67 | 3440750 4480072 7050288 | 15265 | -0.085 | 0.0082 | No | ||
| 73 | CDC20 | 3440017 3440044 6220088 | 15274 | -0.085 | 0.0113 | No | ||
| 74 | ADAM8 | 450347 5670609 | 15357 | -0.090 | 0.0105 | No | ||
| 75 | MCM2 | 5050139 | 15554 | -0.103 | 0.0041 | No | ||
| 76 | ASF1B | 6590706 | 16056 | -0.147 | -0.0169 | No | ||
| 77 | CENPK | 1740722 6200068 | 16122 | -0.153 | -0.0142 | No | ||
| 78 | GAS6 | 4480021 | 16478 | -0.197 | -0.0254 | No | ||
| 79 | RFC5 | 3800452 6020091 | 16682 | -0.225 | -0.0272 | No | ||
| 80 | TCF19 | 6200152 | 17112 | -0.293 | -0.0384 | No | ||
| 81 | DTYMK | 2340377 | 18053 | -0.586 | -0.0653 | No | ||
| 82 | TYMS | 940450 1940068 3710008 5570546 | 18578 | -2.352 | 0.0021 | No |