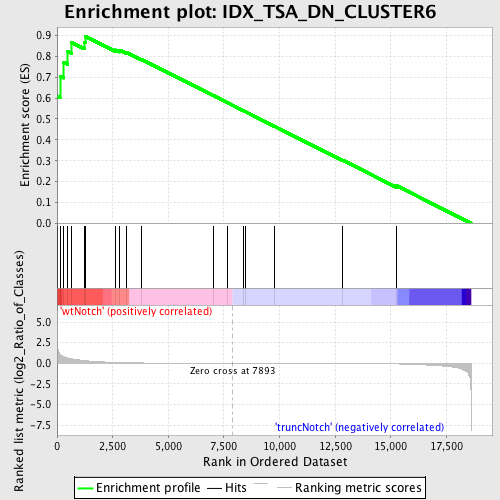
Profile of the Running ES Score & Positions of GeneSet Members on the Rank Ordered List
| Dataset | Set_03_wtNotch_versus_truncNotch.phenotype_wtNotch_versus_truncNotch.cls #wtNotch_versus_truncNotch.phenotype_wtNotch_versus_truncNotch.cls #wtNotch_versus_truncNotch_repos |
| Phenotype | phenotype_wtNotch_versus_truncNotch.cls#wtNotch_versus_truncNotch_repos |
| Upregulated in class | wtNotch |
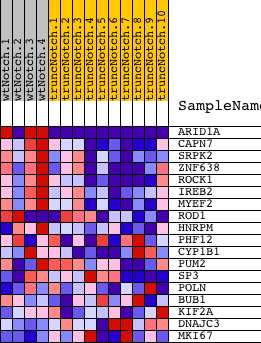
| GeneSet | IDX_TSA_DN_CLUSTER6 |
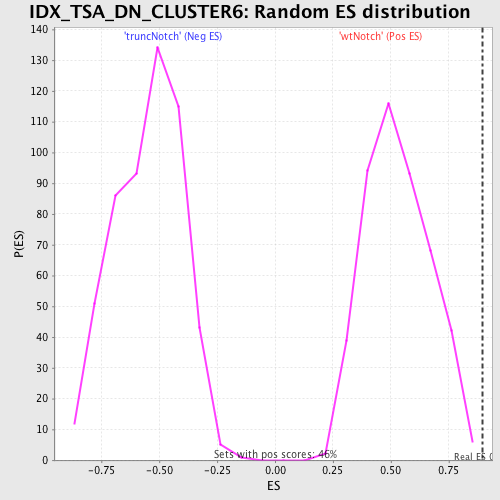
| Enrichment Score (ES) | 0.89456356 |
| Normalized Enrichment Score (NES) | 1.6858869 |
| Nominal p-value | 0.002173913 |
| FDR q-value | 0.12593432 |
| FWER p-Value | 0.539 |
| PROBE | DESCRIPTION (from dataset) | GENE SYMBOL | GENE_TITLE | RANK IN GENE LIST | RANK METRIC SCORE | RUNNING ES | CORE ENRICHMENT | |
|---|---|---|---|---|---|---|---|---|
| 1 | ARID1A | 2630022 1690551 4810110 | 0 | 6.327 | 0.6090 | Yes | ||
| 2 | CAPN7 | 5550050 | 131 | 1.074 | 0.7053 | Yes | ||
| 3 | SRPK2 | 6380341 | 304 | 0.780 | 0.7712 | Yes | ||
| 4 | ZNF638 | 6510112 | 471 | 0.641 | 0.8239 | Yes | ||
| 5 | ROCK1 | 130044 | 640 | 0.542 | 0.8670 | Yes | ||
| 6 | IREB2 | 1570202 2640114 | 1238 | 0.325 | 0.8662 | Yes | ||
| 7 | MYEF2 | 6860484 | 1278 | 0.316 | 0.8946 | Yes | ||
| 8 | ROD1 | 2060324 3140332 | 2643 | 0.094 | 0.8302 | No | ||
| 9 | HNRPM | 450497 4540451 | 2824 | 0.080 | 0.8283 | No | ||
| 10 | PHF12 | 870400 3130687 | 3121 | 0.060 | 0.8181 | No | ||
| 11 | CYP1B1 | 4760735 | 3790 | 0.032 | 0.7853 | No | ||
| 12 | PUM2 | 4200441 5910446 | 7014 | 0.003 | 0.6122 | No | ||
| 13 | SP3 | 3840338 | 7644 | 0.001 | 0.5785 | No | ||
| 14 | POLN | 5290524 | 8382 | -0.001 | 0.5390 | No | ||
| 15 | BUB1 | 5390270 | 8455 | -0.002 | 0.5353 | No | ||
| 16 | KIF2A | 3990286 6130575 | 9788 | -0.005 | 0.4642 | No | ||
| 17 | DNAJC3 | 5720301 | 12838 | -0.023 | 0.3025 | No | ||
| 18 | MKI67 | 3440750 4480072 7050288 | 15265 | -0.085 | 0.1802 | No |