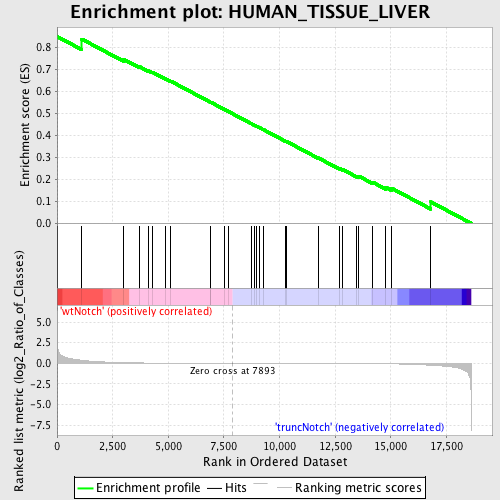
Profile of the Running ES Score & Positions of GeneSet Members on the Rank Ordered List
| Dataset | Set_03_wtNotch_versus_truncNotch.phenotype_wtNotch_versus_truncNotch.cls #wtNotch_versus_truncNotch.phenotype_wtNotch_versus_truncNotch.cls #wtNotch_versus_truncNotch_repos |
| Phenotype | phenotype_wtNotch_versus_truncNotch.cls#wtNotch_versus_truncNotch_repos |
| Upregulated in class | wtNotch |
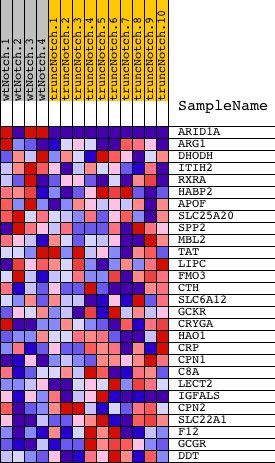
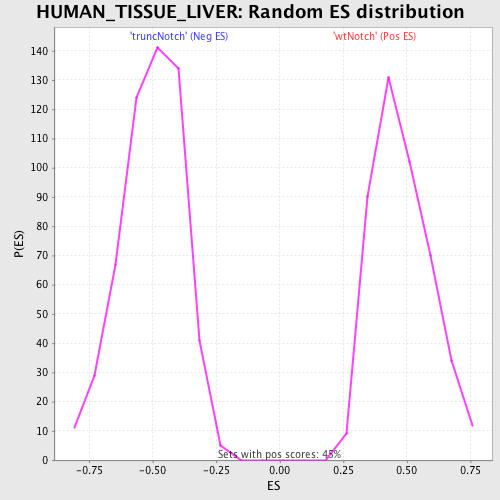
| GeneSet | HUMAN_TISSUE_LIVER |
| Enrichment Score (ES) | 0.85018593 |
| Normalized Enrichment Score (NES) | 1.7703915 |
| Nominal p-value | 0.0 |
| FDR q-value | 0.1138816 |
| FWER p-Value | 0.101 |
| PROBE | DESCRIPTION (from dataset) | GENE SYMBOL | GENE_TITLE | RANK IN GENE LIST | RANK METRIC SCORE | RUNNING ES | CORE ENRICHMENT | |
|---|---|---|---|---|---|---|---|---|
| 1 | ARID1A | 2630022 1690551 4810110 | 0 | 6.327 | 0.8502 | Yes | ||
| 2 | ARG1 | 840707 | 1107 | 0.357 | 0.8386 | No | ||
| 3 | DHODH | 3170072 | 2982 | 0.069 | 0.7470 | No | ||
| 4 | ITIH2 | 2970707 | 3687 | 0.035 | 0.7138 | No | ||
| 5 | RXRA | 3800471 | 4111 | 0.024 | 0.6943 | No | ||
| 6 | HABP2 | 5360541 6350273 | 4269 | 0.021 | 0.6888 | No | ||
| 7 | APOF | 5270707 | 4893 | 0.013 | 0.6571 | No | ||
| 8 | SLC25A20 | 3190427 | 5107 | 0.012 | 0.6472 | No | ||
| 9 | SPP2 | 3840253 | 6882 | 0.003 | 0.5521 | No | ||
| 10 | MBL2 | 6370446 | 6910 | 0.003 | 0.5511 | No | ||
| 11 | TAT | 7000427 | 7535 | 0.001 | 0.5176 | No | ||
| 12 | LIPC | 2690497 | 7693 | 0.001 | 0.5093 | No | ||
| 13 | FMO3 | 2480369 | 8718 | -0.002 | 0.4545 | No | ||
| 14 | CTH | 1190332 5290139 | 8861 | -0.003 | 0.4472 | No | ||
| 15 | SLC6A12 | 3170685 | 8948 | -0.003 | 0.4430 | No | ||
| 16 | GCKR | 4070035 | 9087 | -0.003 | 0.4360 | No | ||
| 17 | CRYGA | 2340309 | 9277 | -0.004 | 0.4264 | No | ||
| 18 | HAO1 | 7050093 | 10287 | -0.007 | 0.3731 | No | ||
| 19 | CRP | 3140711 | 10305 | -0.007 | 0.3731 | No | ||
| 20 | CPN1 | 1940114 | 11740 | -0.014 | 0.2979 | No | ||
| 21 | C8A | 2190601 | 12682 | -0.021 | 0.2501 | No | ||
| 22 | LECT2 | 50279 | 12842 | -0.023 | 0.2447 | No | ||
| 23 | IGFALS | 6350195 | 13472 | -0.031 | 0.2151 | No | ||
| 24 | CPN2 | 6590291 | 13565 | -0.033 | 0.2146 | No | ||
| 25 | SLC22A1 | 450082 4010722 | 14182 | -0.045 | 0.1875 | No | ||
| 26 | F12 | 1090215 3520736 | 14778 | -0.063 | 0.1640 | No | ||
| 27 | GCGR | 6620497 | 15036 | -0.073 | 0.1599 | No | ||
| 28 | DDT | 4590398 | 16798 | -0.243 | 0.0978 | No |