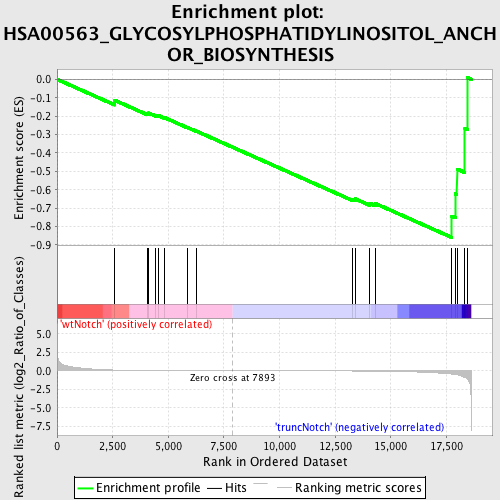
Profile of the Running ES Score & Positions of GeneSet Members on the Rank Ordered List
| Dataset | Set_03_wtNotch_versus_truncNotch.phenotype_wtNotch_versus_truncNotch.cls #wtNotch_versus_truncNotch.phenotype_wtNotch_versus_truncNotch.cls #wtNotch_versus_truncNotch_repos |
| Phenotype | phenotype_wtNotch_versus_truncNotch.cls#wtNotch_versus_truncNotch_repos |
| Upregulated in class | truncNotch |
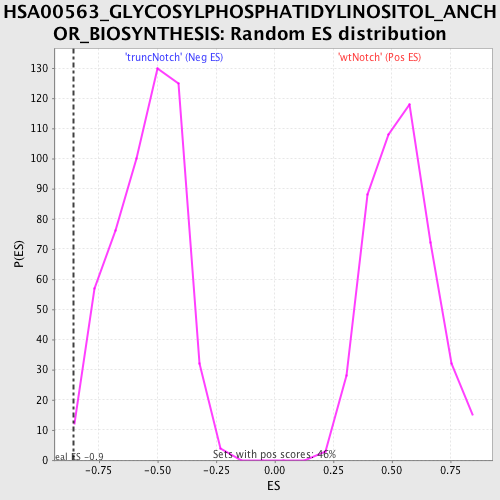
| GeneSet | HSA00563_GLYCOSYLPHOSPHATIDYLINOSITOL_ANCHOR_BIOSYNTHESIS |
| Enrichment Score (ES) | -0.85946727 |
| Normalized Enrichment Score (NES) | -1.5822611 |
| Nominal p-value | 0.009328358 |
| FDR q-value | 0.23460409 |
| FWER p-Value | 0.988 |
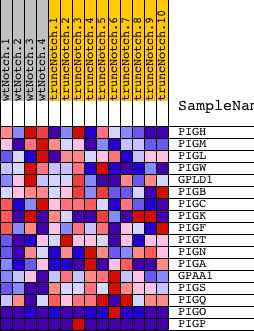
| PROBE | DESCRIPTION (from dataset) | GENE SYMBOL | GENE_TITLE | RANK IN GENE LIST | RANK METRIC SCORE | RUNNING ES | CORE ENRICHMENT | |
|---|---|---|---|---|---|---|---|---|
| 1 | PIGH | 1500484 | 2593 | 0.098 | -0.1139 | No | ||
| 2 | PIGM | 2680377 | 4040 | 0.026 | -0.1850 | No | ||
| 3 | PIGL | 4060497 | 4115 | 0.024 | -0.1827 | No | ||
| 4 | PIGW | 4810072 | 4441 | 0.019 | -0.1953 | No | ||
| 5 | GPLD1 | 6100121 6290154 | 4555 | 0.017 | -0.1969 | No | ||
| 6 | PIGB | 2850193 6380286 | 4833 | 0.014 | -0.2081 | No | ||
| 7 | PIGC | 5690377 | 5864 | 0.007 | -0.2617 | No | ||
| 8 | PIGK | 4540193 6350324 6860736 | 6245 | 0.005 | -0.2807 | No | ||
| 9 | PIGF | 5690050 | 13291 | -0.029 | -0.6520 | No | ||
| 10 | PIGT | 2360180 6840019 | 13400 | -0.030 | -0.6499 | No | ||
| 11 | PIGN | 4210736 | 14056 | -0.042 | -0.6741 | No | ||
| 12 | PIGA | 1940435 5290692 | 14316 | -0.048 | -0.6755 | No | ||
| 13 | GPAA1 | 1500463 | 17739 | -0.443 | -0.7441 | Yes | ||
| 14 | PIGS | 3610142 | 17896 | -0.500 | -0.6224 | Yes | ||
| 15 | PIGQ | 4540286 1450452 | 17974 | -0.533 | -0.4876 | Yes | ||
| 16 | PIGO | 1400528 2340026 5340097 | 18329 | -0.914 | -0.2685 | Yes | ||
| 17 | PIGP | 4280204 5890440 | 18437 | -1.090 | 0.0096 | Yes |