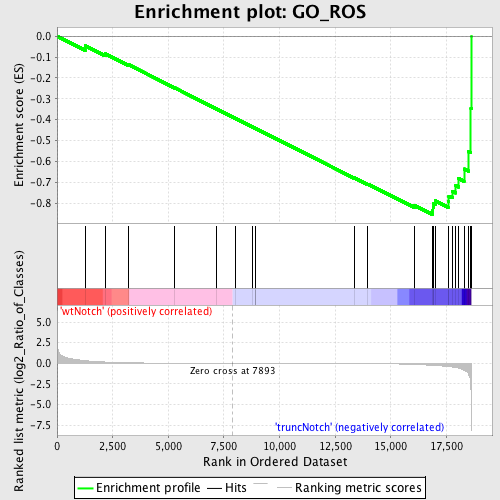
Profile of the Running ES Score & Positions of GeneSet Members on the Rank Ordered List
| Dataset | Set_03_wtNotch_versus_truncNotch.phenotype_wtNotch_versus_truncNotch.cls #wtNotch_versus_truncNotch.phenotype_wtNotch_versus_truncNotch.cls #wtNotch_versus_truncNotch_repos |
| Phenotype | phenotype_wtNotch_versus_truncNotch.cls#wtNotch_versus_truncNotch_repos |
| Upregulated in class | truncNotch |
| GeneSet | GO_ROS |
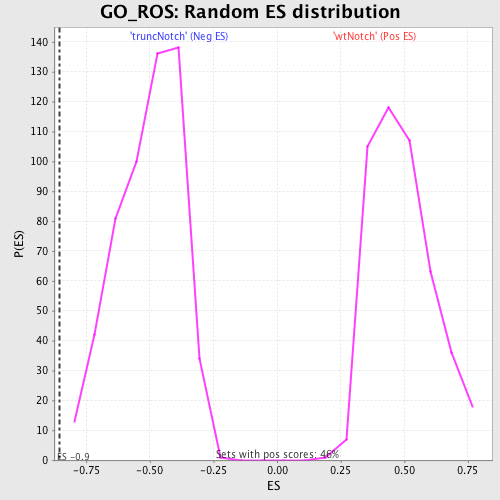
| Enrichment Score (ES) | -0.8537852 |
| Normalized Enrichment Score (NES) | -1.6934879 |
| Nominal p-value | 0.0 |
| FDR q-value | 0.20621844 |
| FWER p-Value | 0.357 |
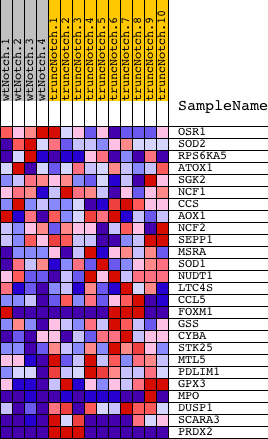
| PROBE | DESCRIPTION (from dataset) | GENE SYMBOL | GENE_TITLE | RANK IN GENE LIST | RANK METRIC SCORE | RUNNING ES | CORE ENRICHMENT | |
|---|---|---|---|---|---|---|---|---|
| 1 | OSR1 | 1500025 | 1264 | 0.319 | -0.0458 | No | ||
| 2 | SOD2 | 1410053 | 2169 | 0.142 | -0.0845 | No | ||
| 3 | RPS6KA5 | 2120563 7040546 | 3195 | 0.055 | -0.1358 | No | ||
| 4 | ATOX1 | 1090497 | 5294 | 0.010 | -0.2479 | No | ||
| 5 | SGK2 | 1850070 | 7158 | 0.002 | -0.3480 | No | ||
| 6 | NCF1 | 3850091 | 8001 | -0.000 | -0.3933 | No | ||
| 7 | CCS | 3450524 | 8767 | -0.002 | -0.4342 | No | ||
| 8 | AOX1 | 110082 6290450 | 8896 | -0.003 | -0.4409 | No | ||
| 9 | NCF2 | 540129 2370441 2650133 | 8921 | -0.003 | -0.4420 | No | ||
| 10 | SEPP1 | 450273 | 8934 | -0.003 | -0.4425 | No | ||
| 11 | MSRA | 4570411 | 13360 | -0.030 | -0.6784 | No | ||
| 12 | SOD1 | 5890070 | 13972 | -0.040 | -0.7085 | No | ||
| 13 | NUDT1 | 2850600 | 16059 | -0.148 | -0.8104 | No | ||
| 14 | LTC4S | 2570411 | 16866 | -0.254 | -0.8361 | Yes | ||
| 15 | CCL5 | 3710397 | 16895 | -0.258 | -0.8197 | Yes | ||
| 16 | FOXM1 | 6650402 6980091 | 16914 | -0.261 | -0.8026 | Yes | ||
| 17 | GSS | 6130465 6900398 | 17008 | -0.274 | -0.7885 | Yes | ||
| 18 | CYBA | 4760739 | 17579 | -0.389 | -0.7921 | Yes | ||
| 19 | STK25 | 1090519 1500193 | 17608 | -0.398 | -0.7660 | Yes | ||
| 20 | MTL5 | 6940300 | 17769 | -0.454 | -0.7430 | Yes | ||
| 21 | PDLIM1 | 450100 | 17920 | -0.511 | -0.7156 | Yes | ||
| 22 | GPX3 | 1340450 | 18050 | -0.585 | -0.6819 | Yes | ||
| 23 | MPO | 2360176 2760440 5690176 | 18293 | -0.849 | -0.6359 | Yes | ||
| 24 | DUSP1 | 6860121 | 18501 | -1.337 | -0.5541 | Yes | ||
| 25 | SCARA3 | 5890487 | 18600 | -3.084 | -0.3449 | Yes | ||
| 26 | PRDX2 | 6760095 4010619 5340577 | 18614 | -4.972 | 0.0001 | Yes |