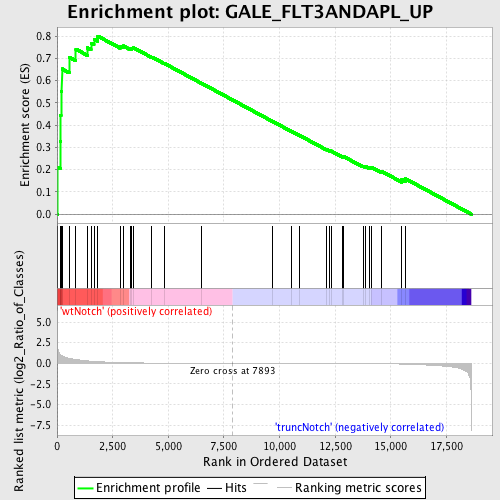
Profile of the Running ES Score & Positions of GeneSet Members on the Rank Ordered List
| Dataset | Set_03_wtNotch_versus_truncNotch.phenotype_wtNotch_versus_truncNotch.cls #wtNotch_versus_truncNotch.phenotype_wtNotch_versus_truncNotch.cls #wtNotch_versus_truncNotch_repos |
| Phenotype | phenotype_wtNotch_versus_truncNotch.cls#wtNotch_versus_truncNotch_repos |
| Upregulated in class | wtNotch |
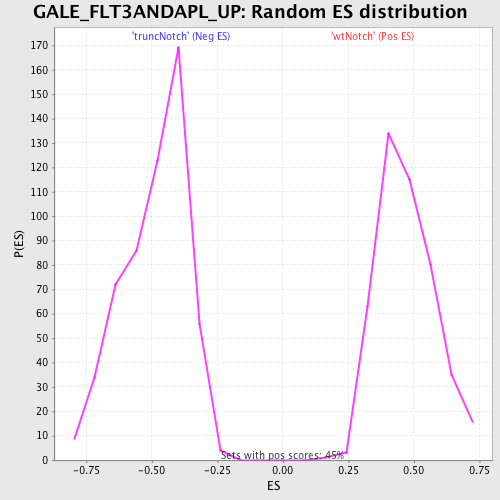
| GeneSet | GALE_FLT3ANDAPL_UP |
| Enrichment Score (ES) | 0.80011815 |
| Normalized Enrichment Score (NES) | 1.7073649 |
| Nominal p-value | 0.0 |
| FDR q-value | 0.091057725 |
| FWER p-Value | 0.389 |
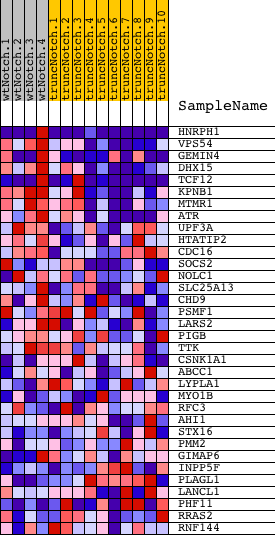
| PROBE | DESCRIPTION (from dataset) | GENE SYMBOL | GENE_TITLE | RANK IN GENE LIST | RANK METRIC SCORE | RUNNING ES | CORE ENRICHMENT | |
|---|---|---|---|---|---|---|---|---|
| 1 | HNRPH1 | 1170086 3140546 3290471 6110184 6110373 | 25 | 1.818 | 0.2096 | Yes | ||
| 2 | VPS54 | 1660168 | 139 | 1.061 | 0.3267 | Yes | ||
| 3 | GEMIN4 | 130278 2230075 | 155 | 1.013 | 0.4435 | Yes | ||
| 4 | DHX15 | 870632 | 177 | 0.952 | 0.5528 | Yes | ||
| 5 | TCF12 | 3610324 7000156 | 219 | 0.880 | 0.6528 | Yes | ||
| 6 | KPNB1 | 1690138 | 543 | 0.602 | 0.7052 | Yes | ||
| 7 | MTMR1 | 1660131 | 845 | 0.450 | 0.7413 | Yes | ||
| 8 | ATR | 6860273 | 1357 | 0.292 | 0.7477 | Yes | ||
| 9 | UPF3A | 2360333 5340008 | 1526 | 0.250 | 0.7676 | Yes | ||
| 10 | HTATIP2 | 3120465 | 1659 | 0.224 | 0.7866 | Yes | ||
| 11 | CDC16 | 1940706 | 1827 | 0.194 | 0.8001 | Yes | ||
| 12 | SOCS2 | 4760692 | 2829 | 0.080 | 0.7555 | No | ||
| 13 | NOLC1 | 2350195 | 2970 | 0.070 | 0.7561 | No | ||
| 14 | SLC25A13 | 4920072 5690722 | 3288 | 0.050 | 0.7449 | No | ||
| 15 | CHD9 | 430037 2570129 5420398 | 3360 | 0.048 | 0.7466 | No | ||
| 16 | PSMF1 | 5340056 | 3424 | 0.045 | 0.7484 | No | ||
| 17 | LARS2 | 7000706 | 4256 | 0.022 | 0.7062 | No | ||
| 18 | PIGB | 2850193 6380286 | 4833 | 0.014 | 0.6769 | No | ||
| 19 | TTK | 3800129 | 6474 | 0.004 | 0.5891 | No | ||
| 20 | CSNK1A1 | 2340427 | 9666 | -0.005 | 0.4180 | No | ||
| 21 | ABCC1 | 4760722 6770280 | 10514 | -0.008 | 0.3733 | No | ||
| 22 | LYPLA1 | 4480373 5570551 | 10908 | -0.010 | 0.3533 | No | ||
| 23 | MYO1B | 770372 | 12117 | -0.016 | 0.2902 | No | ||
| 24 | RFC3 | 1980600 | 12248 | -0.018 | 0.2853 | No | ||
| 25 | AHI1 | 460520 | 12312 | -0.018 | 0.2840 | No | ||
| 26 | STX16 | 70315 | 12839 | -0.023 | 0.2584 | No | ||
| 27 | PMM2 | 670673 2570044 2690093 4540068 6450056 | 12853 | -0.023 | 0.2604 | No | ||
| 28 | GIMAP6 | 2470014 | 13749 | -0.036 | 0.2164 | No | ||
| 29 | INPP5F | 60010 5360164 | 13879 | -0.039 | 0.2140 | No | ||
| 30 | PLAGL1 | 3190082 6200193 | 14019 | -0.041 | 0.2113 | No | ||
| 31 | LANCL1 | 1770079 6420670 | 14123 | -0.044 | 0.2109 | No | ||
| 32 | PHF11 | 630025 1170358 | 14574 | -0.056 | 0.1931 | No | ||
| 33 | RRAS2 | 6290170 | 15493 | -0.099 | 0.1553 | No | ||
| 34 | RNF144 | 4210332 | 15662 | -0.110 | 0.1590 | No |