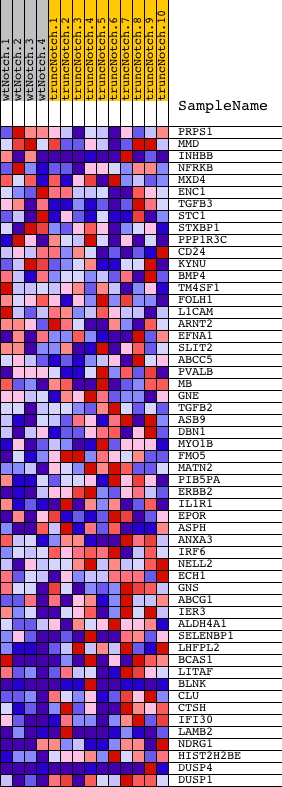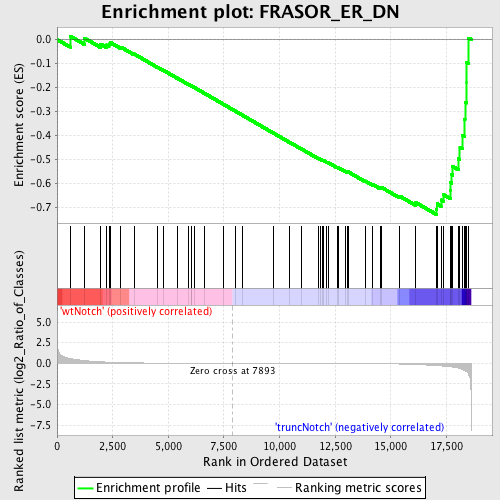
Profile of the Running ES Score & Positions of GeneSet Members on the Rank Ordered List
| Dataset | Set_03_wtNotch_versus_truncNotch.phenotype_wtNotch_versus_truncNotch.cls #wtNotch_versus_truncNotch.phenotype_wtNotch_versus_truncNotch.cls #wtNotch_versus_truncNotch_repos |
| Phenotype | phenotype_wtNotch_versus_truncNotch.cls#wtNotch_versus_truncNotch_repos |
| Upregulated in class | truncNotch |
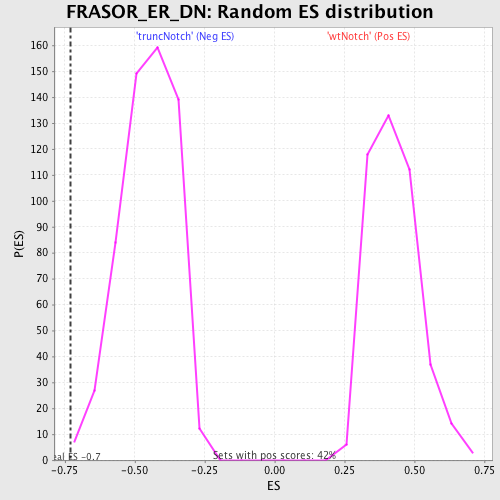
| GeneSet | FRASOR_ER_DN |
| Enrichment Score (ES) | -0.730529 |
| Normalized Enrichment Score (NES) | -1.6167612 |
| Nominal p-value | 0.0034662045 |
| FDR q-value | 0.21144804 |
| FWER p-Value | 0.92 |
| PROBE | DESCRIPTION (from dataset) | GENE SYMBOL | GENE_TITLE | RANK IN GENE LIST | RANK METRIC SCORE | RUNNING ES | CORE ENRICHMENT | |
|---|---|---|---|---|---|---|---|---|
| 1 | PRPS1 | 6350129 | 587 | 0.570 | 0.0142 | No | ||
| 2 | MMD | 3850239 | 1236 | 0.326 | 0.0055 | No | ||
| 3 | INHBB | 2680092 | 1954 | 0.175 | -0.0191 | No | ||
| 4 | NFRKB | 3130538 | 2226 | 0.135 | -0.0228 | No | ||
| 5 | MXD4 | 4810113 | 2333 | 0.123 | -0.0187 | No | ||
| 6 | ENC1 | 4810348 | 2393 | 0.117 | -0.0125 | No | ||
| 7 | TGFB3 | 1070041 | 2869 | 0.077 | -0.0319 | No | ||
| 8 | STC1 | 360161 | 3464 | 0.043 | -0.0604 | No | ||
| 9 | STXBP1 | 360072 6220717 | 4526 | 0.018 | -0.1161 | No | ||
| 10 | PPP1R3C | 2640170 | 4773 | 0.015 | -0.1282 | No | ||
| 11 | CD24 | 1780091 | 5389 | 0.010 | -0.1606 | No | ||
| 12 | KYNU | 1410435 | 5919 | 0.007 | -0.1885 | No | ||
| 13 | BMP4 | 380113 | 6019 | 0.006 | -0.1933 | No | ||
| 14 | TM4SF1 | 2570021 | 6041 | 0.006 | -0.1940 | No | ||
| 15 | FOLH1 | 3290300 | 6154 | 0.006 | -0.1996 | No | ||
| 16 | L1CAM | 4850021 | 6622 | 0.004 | -0.2244 | No | ||
| 17 | ARNT2 | 1740594 | 7483 | 0.001 | -0.2706 | No | ||
| 18 | EFNA1 | 3840672 | 8028 | -0.000 | -0.2999 | No | ||
| 19 | SLIT2 | 1940037 | 8313 | -0.001 | -0.3151 | No | ||
| 20 | ABCC5 | 2100600 5050692 | 9721 | -0.005 | -0.3905 | No | ||
| 21 | PVALB | 5570450 | 10449 | -0.008 | -0.4290 | No | ||
| 22 | MB | 730019 | 10975 | -0.010 | -0.4565 | No | ||
| 23 | GNE | 6100465 | 11755 | -0.014 | -0.4974 | No | ||
| 24 | TGFB2 | 4920292 | 11832 | -0.015 | -0.5003 | No | ||
| 25 | ASB9 | 6020500 | 11945 | -0.015 | -0.5051 | No | ||
| 26 | DBN1 | 7100537 | 11966 | -0.015 | -0.5049 | No | ||
| 27 | MYO1B | 770372 | 12117 | -0.016 | -0.5117 | No | ||
| 28 | FMO5 | 4810725 5390086 | 12181 | -0.017 | -0.5137 | No | ||
| 29 | MATN2 | 460215 | 12597 | -0.021 | -0.5344 | No | ||
| 30 | PIB5PA | 6900427 | 12659 | -0.021 | -0.5360 | No | ||
| 31 | ERBB2 | 3830673 | 12947 | -0.024 | -0.5495 | No | ||
| 32 | IL1R1 | 3850377 6180128 | 13062 | -0.026 | -0.5536 | No | ||
| 33 | EPOR | 5290435 | 13080 | -0.026 | -0.5524 | No | ||
| 34 | ASPH | 360722 1940039 2100066 2340121 2650113 2810064 2970008 3140040 3800750 4210014 4280133 4590035 4760433 6370671 6940338 | 13848 | -0.038 | -0.5907 | No | ||
| 35 | ANXA3 | 5570494 | 14175 | -0.045 | -0.6046 | No | ||
| 36 | IRF6 | 840241 2640139 4050373 6840471 | 14527 | -0.055 | -0.6191 | No | ||
| 37 | NELL2 | 2340725 4280301 5420008 | 14588 | -0.057 | -0.6178 | No | ||
| 38 | ECH1 | 4120746 | 15393 | -0.092 | -0.6537 | No | ||
| 39 | GNS | 3120458 | 16125 | -0.154 | -0.6807 | No | ||
| 40 | ABCG1 | 60692 | 17050 | -0.283 | -0.7078 | Yes | ||
| 41 | IER3 | 5860021 | 17075 | -0.287 | -0.6860 | Yes | ||
| 42 | ALDH4A1 | 2450450 | 17260 | -0.324 | -0.6699 | Yes | ||
| 43 | SELENBP1 | 3850575 | 17374 | -0.346 | -0.6482 | Yes | ||
| 44 | LHFPL2 | 450020 | 17668 | -0.418 | -0.6304 | Yes | ||
| 45 | BCAS1 | 2030711 | 17674 | -0.419 | -0.5969 | Yes | ||
| 46 | LITAF | 6940671 | 17740 | -0.443 | -0.5649 | Yes | ||
| 47 | BLNK | 70288 6590092 | 17777 | -0.456 | -0.5302 | Yes | ||
| 48 | CLU | 5420075 | 18037 | -0.576 | -0.4979 | Yes | ||
| 49 | CTSH | 60524 | 18108 | -0.625 | -0.4514 | Yes | ||
| 50 | IFI30 | 730309 2940500 | 18206 | -0.716 | -0.3991 | Yes | ||
| 51 | LAMB2 | 4920184 | 18308 | -0.882 | -0.3336 | Yes | ||
| 52 | NDRG1 | 1340040 | 18336 | -0.922 | -0.2610 | Yes | ||
| 53 | HIST2H2BE | 3360184 | 18415 | -1.046 | -0.1811 | Yes | ||
| 54 | DUSP4 | 2690044 2850593 | 18417 | -1.050 | -0.0968 | Yes | ||
| 55 | DUSP1 | 6860121 | 18501 | -1.337 | 0.0062 | Yes |