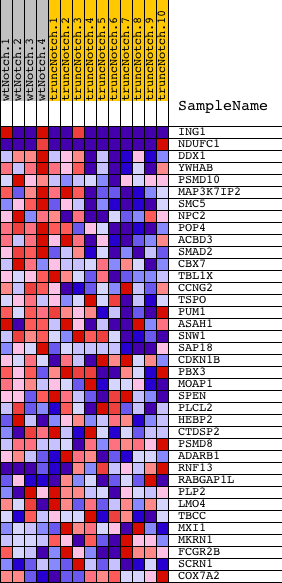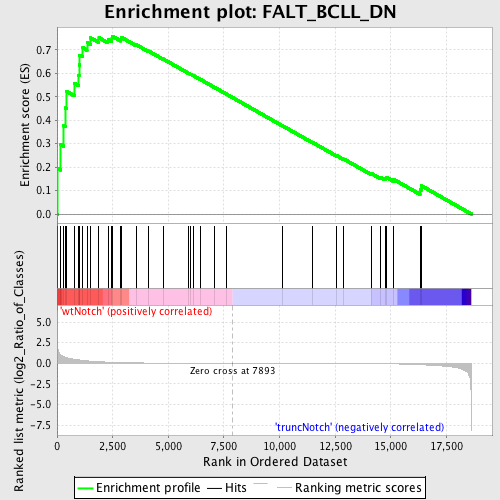
Profile of the Running ES Score & Positions of GeneSet Members on the Rank Ordered List
| Dataset | Set_03_wtNotch_versus_truncNotch.phenotype_wtNotch_versus_truncNotch.cls #wtNotch_versus_truncNotch.phenotype_wtNotch_versus_truncNotch.cls #wtNotch_versus_truncNotch_repos |
| Phenotype | phenotype_wtNotch_versus_truncNotch.cls#wtNotch_versus_truncNotch_repos |
| Upregulated in class | wtNotch |
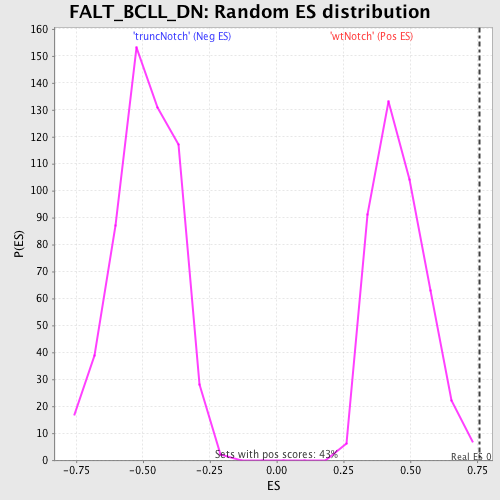
| GeneSet | FALT_BCLL_DN |
| Enrichment Score (ES) | 0.7583251 |
| Normalized Enrichment Score (NES) | 1.6573659 |
| Nominal p-value | 0.0046948357 |
| FDR q-value | 0.13560125 |
| FWER p-Value | 0.747 |
| PROBE | DESCRIPTION (from dataset) | GENE SYMBOL | GENE_TITLE | RANK IN GENE LIST | RANK METRIC SCORE | RUNNING ES | CORE ENRICHMENT | |
|---|---|---|---|---|---|---|---|---|
| 1 | ING1 | 5690010 6520056 | 33 | 1.765 | 0.1947 | Yes | ||
| 2 | NDUFC1 | 2570377 4200239 | 166 | 0.970 | 0.2956 | Yes | ||
| 3 | DDX1 | 3450047 | 298 | 0.784 | 0.3758 | Yes | ||
| 4 | YWHAB | 1740176 | 365 | 0.719 | 0.4523 | Yes | ||
| 5 | PSMD10 | 520494 1170576 3830050 | 434 | 0.660 | 0.5221 | Yes | ||
| 6 | MAP3K7IP2 | 2340242 | 775 | 0.481 | 0.5573 | Yes | ||
| 7 | SMC5 | 3440164 | 970 | 0.408 | 0.5923 | Yes | ||
| 8 | NPC2 | 2350102 | 989 | 0.401 | 0.6359 | Yes | ||
| 9 | POP4 | 4560600 | 1015 | 0.388 | 0.6778 | Yes | ||
| 10 | ACBD3 | 2760170 | 1156 | 0.346 | 0.7088 | Yes | ||
| 11 | SMAD2 | 4200592 | 1345 | 0.295 | 0.7315 | Yes | ||
| 12 | CBX7 | 3940035 | 1513 | 0.253 | 0.7506 | Yes | ||
| 13 | TBL1X | 6400524 | 1881 | 0.184 | 0.7514 | Yes | ||
| 14 | CCNG2 | 3190095 | 2287 | 0.128 | 0.7438 | Yes | ||
| 15 | TSPO | 110692 3390452 | 2465 | 0.109 | 0.7464 | Yes | ||
| 16 | PUM1 | 6130500 | 2470 | 0.109 | 0.7583 | Yes | ||
| 17 | ASAH1 | 510152 1340484 1740707 | 2860 | 0.078 | 0.7460 | No | ||
| 18 | SNW1 | 4010736 | 2876 | 0.076 | 0.7537 | No | ||
| 19 | SAP18 | 3610092 | 3548 | 0.040 | 0.7220 | No | ||
| 20 | CDKN1B | 3800025 6450044 | 4101 | 0.024 | 0.6950 | No | ||
| 21 | PBX3 | 1300424 3710577 6180575 | 4765 | 0.015 | 0.6610 | No | ||
| 22 | MOAP1 | 580537 | 5922 | 0.007 | 0.5995 | No | ||
| 23 | SPEN | 2060041 | 6010 | 0.006 | 0.5955 | No | ||
| 24 | PLCL2 | 6100575 | 6138 | 0.006 | 0.5893 | No | ||
| 25 | HEBP2 | 1990309 | 6423 | 0.005 | 0.5746 | No | ||
| 26 | CTDSP2 | 5340315 5690133 | 7058 | 0.002 | 0.5407 | No | ||
| 27 | PSMD8 | 630142 | 7604 | 0.001 | 0.5115 | No | ||
| 28 | ADARB1 | 780451 | 10124 | -0.007 | 0.3766 | No | ||
| 29 | RNF13 | 2370021 | 11491 | -0.012 | 0.3045 | No | ||
| 30 | RABGAP1L | 3190014 6860088 | 12566 | -0.020 | 0.2490 | No | ||
| 31 | PLP2 | 2100167 | 12880 | -0.024 | 0.2347 | No | ||
| 32 | LMO4 | 3800746 | 14148 | -0.045 | 0.1715 | No | ||
| 33 | TBCC | 4810021 | 14542 | -0.055 | 0.1565 | No | ||
| 34 | MXI1 | 5050064 5130484 | 14746 | -0.061 | 0.1524 | No | ||
| 35 | MKRN1 | 1410097 | 14785 | -0.063 | 0.1574 | No | ||
| 36 | FCGR2B | 780750 | 15129 | -0.078 | 0.1476 | No | ||
| 37 | SCRN1 | 6040025 6580019 | 16314 | -0.177 | 0.1035 | No | ||
| 38 | COX7A2 | 4280114 | 16362 | -0.183 | 0.1213 | No |