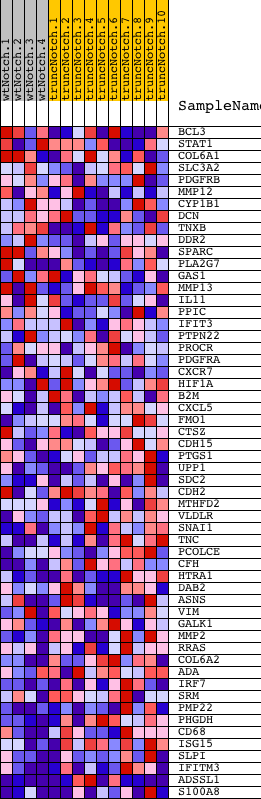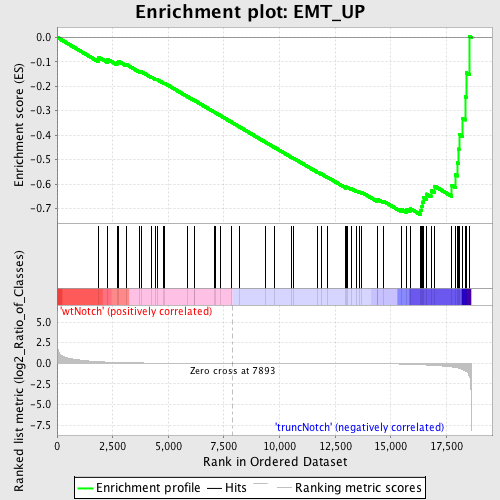
Profile of the Running ES Score & Positions of GeneSet Members on the Rank Ordered List
| Dataset | Set_03_wtNotch_versus_truncNotch.phenotype_wtNotch_versus_truncNotch.cls #wtNotch_versus_truncNotch.phenotype_wtNotch_versus_truncNotch.cls #wtNotch_versus_truncNotch_repos |
| Phenotype | phenotype_wtNotch_versus_truncNotch.cls#wtNotch_versus_truncNotch_repos |
| Upregulated in class | truncNotch |
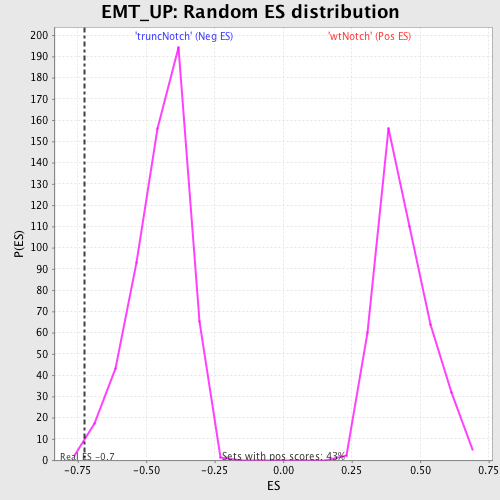
| GeneSet | EMT_UP |
| Enrichment Score (ES) | -0.7238764 |
| Normalized Enrichment Score (NES) | -1.6230763 |
| Nominal p-value | 0.003502627 |
| FDR q-value | 0.20919938 |
| FWER p-Value | 0.892 |
| PROBE | DESCRIPTION (from dataset) | GENE SYMBOL | GENE_TITLE | RANK IN GENE LIST | RANK METRIC SCORE | RUNNING ES | CORE ENRICHMENT | |
|---|---|---|---|---|---|---|---|---|
| 1 | BCL3 | 3990440 | 1864 | 0.187 | -0.0814 | No | ||
| 2 | STAT1 | 6510204 6590553 | 2257 | 0.131 | -0.0892 | No | ||
| 3 | COL6A1 | 1410670 2940091 6510086 | 2693 | 0.090 | -0.1035 | No | ||
| 4 | SLC3A2 | 5270358 | 2740 | 0.086 | -0.0972 | No | ||
| 5 | PDGFRB | 6450279 | 3105 | 0.061 | -0.1106 | No | ||
| 6 | MMP12 | 4920070 | 3722 | 0.034 | -0.1403 | No | ||
| 7 | CYP1B1 | 4760735 | 3790 | 0.032 | -0.1407 | No | ||
| 8 | DCN | 510332 5340026 5900711 6550092 | 4261 | 0.022 | -0.1638 | No | ||
| 9 | TNXB | 630592 3830020 5360497 7000673 | 4440 | 0.019 | -0.1715 | No | ||
| 10 | DDR2 | 7050273 | 4498 | 0.018 | -0.1728 | No | ||
| 11 | SPARC | 1690086 | 4792 | 0.015 | -0.1871 | No | ||
| 12 | PLA2G7 | 4730092 | 4828 | 0.014 | -0.1875 | No | ||
| 13 | GAS1 | 2120504 | 5882 | 0.007 | -0.2436 | No | ||
| 14 | MMP13 | 510471 3940097 | 6176 | 0.006 | -0.2588 | No | ||
| 15 | IL11 | 1740398 | 6195 | 0.006 | -0.2592 | No | ||
| 16 | PPIC | 4570110 | 7061 | 0.002 | -0.3055 | No | ||
| 17 | IFIT3 | 2450278 3190113 6200113 | 7101 | 0.002 | -0.3074 | No | ||
| 18 | PTPN22 | 1690647 7100239 | 7335 | 0.002 | -0.3198 | No | ||
| 19 | PROCR | 4920687 | 7852 | 0.000 | -0.3476 | No | ||
| 20 | PDGFRA | 2940332 | 8180 | -0.001 | -0.3651 | No | ||
| 21 | CXCR7 | 2630301 | 9363 | -0.004 | -0.4284 | No | ||
| 22 | HIF1A | 5670605 | 9774 | -0.005 | -0.4499 | No | ||
| 23 | B2M | 5080332 5130059 | 10543 | -0.008 | -0.4905 | No | ||
| 24 | CXCL5 | 6370333 | 10617 | -0.008 | -0.4935 | No | ||
| 25 | FMO1 | 5360086 | 11703 | -0.014 | -0.5506 | No | ||
| 26 | CTSZ | 1500687 1690364 | 11868 | -0.015 | -0.5579 | No | ||
| 27 | CDH15 | 460014 | 12140 | -0.017 | -0.5708 | No | ||
| 28 | PTGS1 | 730193 1780273 6450195 | 12981 | -0.025 | -0.6136 | No | ||
| 29 | UPP1 | 3850358 3940100 | 12992 | -0.025 | -0.6116 | No | ||
| 30 | SDC2 | 1980168 | 13057 | -0.026 | -0.6124 | No | ||
| 31 | CDH2 | 520435 2450451 2760025 6650477 | 13234 | -0.028 | -0.6190 | No | ||
| 32 | MTHFD2 | 3800411 | 13471 | -0.031 | -0.6285 | No | ||
| 33 | VLDLR | 870722 3060047 5340452 6550131 | 13598 | -0.033 | -0.6319 | No | ||
| 34 | SNAI1 | 6590253 | 13687 | -0.035 | -0.6331 | No | ||
| 35 | TNC | 670053 1780039 1980020 3060411 4780091 6860433 | 14382 | -0.050 | -0.6654 | No | ||
| 36 | PCOLCE | 4210433 | 14411 | -0.051 | -0.6617 | No | ||
| 37 | CFH | 1240053 2030541 5900731 | 14670 | -0.059 | -0.6696 | No | ||
| 38 | HTRA1 | 3450601 | 15487 | -0.099 | -0.7035 | No | ||
| 39 | DAB2 | 60309 | 15688 | -0.112 | -0.7029 | No | ||
| 40 | ASNS | 110368 7100687 | 15864 | -0.128 | -0.6993 | No | ||
| 41 | VIM | 20431 | 16321 | -0.177 | -0.7059 | Yes | ||
| 42 | GALK1 | 840162 | 16389 | -0.186 | -0.6905 | Yes | ||
| 43 | MMP2 | 2570603 | 16423 | -0.190 | -0.6729 | Yes | ||
| 44 | RRAS | 4150609 | 16477 | -0.197 | -0.6557 | Yes | ||
| 45 | COL6A2 | 1780142 | 16593 | -0.213 | -0.6402 | Yes | ||
| 46 | ADA | 2120403 3130075 | 16808 | -0.245 | -0.6268 | Yes | ||
| 47 | IRF7 | 1570605 | 16971 | -0.268 | -0.6082 | Yes | ||
| 48 | SRM | 1850097 2480162 | 17737 | -0.442 | -0.6044 | Yes | ||
| 49 | PMP22 | 4010239 6550072 | 17895 | -0.499 | -0.5620 | Yes | ||
| 50 | PHGDH | 1500280 | 17984 | -0.536 | -0.5122 | Yes | ||
| 51 | CD68 | 6350450 | 18041 | -0.578 | -0.4564 | Yes | ||
| 52 | ISG15 | 3170093 | 18067 | -0.597 | -0.3969 | Yes | ||
| 53 | SLPI | 2120446 | 18212 | -0.723 | -0.3310 | Yes | ||
| 54 | IFITM3 | 2340358 | 18344 | -0.930 | -0.2434 | Yes | ||
| 55 | ADSSL1 | 4850132 7000288 | 18386 | -0.987 | -0.1451 | Yes | ||
| 56 | S100A8 | 70112 | 18531 | -1.547 | 0.0046 | Yes |