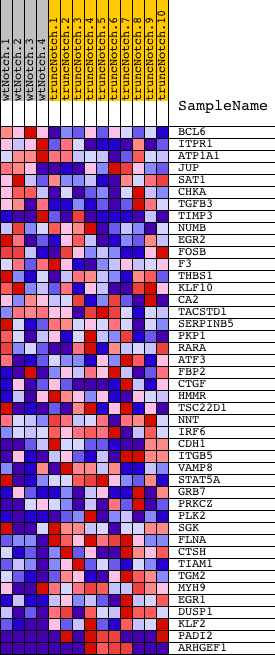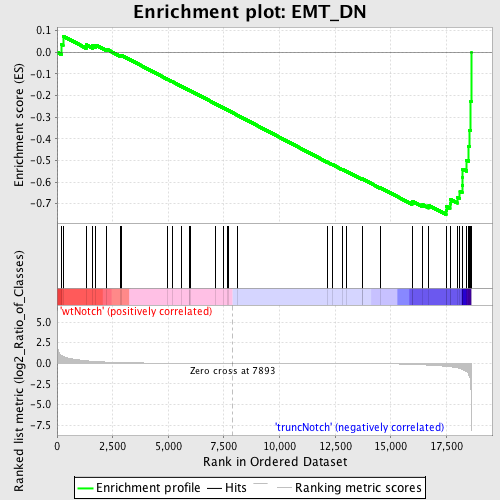
Profile of the Running ES Score & Positions of GeneSet Members on the Rank Ordered List
| Dataset | Set_03_wtNotch_versus_truncNotch.phenotype_wtNotch_versus_truncNotch.cls #wtNotch_versus_truncNotch.phenotype_wtNotch_versus_truncNotch.cls #wtNotch_versus_truncNotch_repos |
| Phenotype | phenotype_wtNotch_versus_truncNotch.cls#wtNotch_versus_truncNotch_repos |
| Upregulated in class | truncNotch |
| GeneSet | EMT_DN |
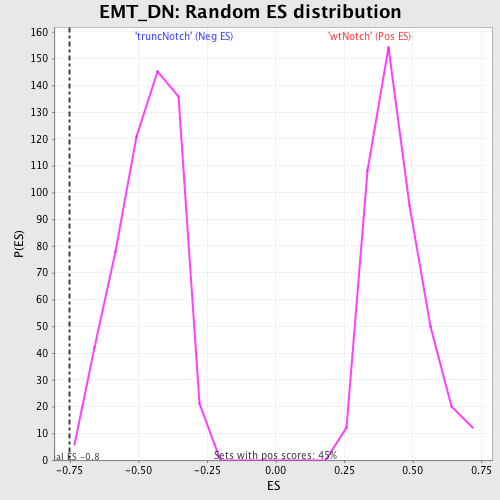
| Enrichment Score (ES) | -0.7501053 |
| Normalized Enrichment Score (NES) | -1.612102 |
| Nominal p-value | 0.0018214936 |
| FDR q-value | 0.21022551 |
| FWER p-Value | 0.937 |
| PROBE | DESCRIPTION (from dataset) | GENE SYMBOL | GENE_TITLE | RANK IN GENE LIST | RANK METRIC SCORE | RUNNING ES | CORE ENRICHMENT | |
|---|---|---|---|---|---|---|---|---|
| 1 | BCL6 | 940100 | 185 | 0.930 | 0.0370 | No | ||
| 2 | ITPR1 | 3450519 | 267 | 0.823 | 0.0742 | No | ||
| 3 | ATP1A1 | 5670451 | 1305 | 0.306 | 0.0338 | No | ||
| 4 | JUP | 2510671 | 1600 | 0.233 | 0.0298 | No | ||
| 5 | SAT1 | 4570463 | 1744 | 0.210 | 0.0327 | No | ||
| 6 | CHKA | 510324 | 2210 | 0.136 | 0.0146 | No | ||
| 7 | TGFB3 | 1070041 | 2869 | 0.077 | -0.0170 | No | ||
| 8 | TIMP3 | 1450504 1980270 | 2872 | 0.077 | -0.0132 | No | ||
| 9 | NUMB | 2450735 3800253 6350040 | 4974 | 0.013 | -0.1257 | No | ||
| 10 | EGR2 | 3800403 | 5194 | 0.011 | -0.1369 | No | ||
| 11 | FOSB | 1940142 | 5612 | 0.008 | -0.1590 | No | ||
| 12 | F3 | 2940180 | 5948 | 0.007 | -0.1767 | No | ||
| 13 | THBS1 | 4560494 430288 | 5957 | 0.007 | -0.1768 | No | ||
| 14 | KLF10 | 4850056 | 5990 | 0.006 | -0.1782 | No | ||
| 15 | CA2 | 1660113 1660600 | 7139 | 0.002 | -0.2399 | No | ||
| 16 | TACSTD1 | 3780025 | 7485 | 0.001 | -0.2584 | No | ||
| 17 | SERPINB5 | 6940050 | 7674 | 0.001 | -0.2685 | No | ||
| 18 | PKP1 | 1500433 | 7698 | 0.001 | -0.2697 | No | ||
| 19 | RARA | 4050161 | 8104 | -0.001 | -0.2915 | No | ||
| 20 | ATF3 | 1940546 | 12131 | -0.017 | -0.5074 | No | ||
| 21 | FBP2 | 1580193 | 12359 | -0.019 | -0.5187 | No | ||
| 22 | CTGF | 4540577 | 12821 | -0.023 | -0.5423 | No | ||
| 23 | HMMR | 5720315 6380168 | 13015 | -0.025 | -0.5515 | No | ||
| 24 | TSC22D1 | 1340739 6040181 | 13710 | -0.036 | -0.5870 | No | ||
| 25 | NNT | 540253 1170471 5550092 6760397 | 13712 | -0.036 | -0.5853 | No | ||
| 26 | IRF6 | 840241 2640139 4050373 6840471 | 14527 | -0.055 | -0.6264 | No | ||
| 27 | CDH1 | 1940736 | 15952 | -0.136 | -0.6962 | No | ||
| 28 | ITGB5 | 70129 | 15977 | -0.139 | -0.6905 | No | ||
| 29 | VAMP8 | 380411 1190139 | 16438 | -0.192 | -0.7055 | No | ||
| 30 | STAT5A | 2680458 | 16710 | -0.230 | -0.7085 | No | ||
| 31 | GRB7 | 2100471 | 17483 | -0.366 | -0.7316 | Yes | ||
| 32 | PRKCZ | 3780279 | 17510 | -0.373 | -0.7142 | Yes | ||
| 33 | PLK2 | 6450152 | 17660 | -0.416 | -0.7012 | Yes | ||
| 34 | SGK | 1400131 2480056 | 17670 | -0.418 | -0.6806 | Yes | ||
| 35 | FLNA | 5390193 | 17979 | -0.535 | -0.6702 | Yes | ||
| 36 | CTSH | 60524 | 18108 | -0.625 | -0.6455 | Yes | ||
| 37 | TIAM1 | 5420288 | 18204 | -0.714 | -0.6146 | Yes | ||
| 38 | TGM2 | 5360452 | 18226 | -0.740 | -0.5783 | Yes | ||
| 39 | MYH9 | 3120091 4850292 | 18234 | -0.754 | -0.5406 | Yes | ||
| 40 | EGR1 | 4610347 | 18402 | -1.010 | -0.4986 | Yes | ||
| 41 | DUSP1 | 6860121 | 18501 | -1.337 | -0.4364 | Yes | ||
| 42 | KLF2 | 6860270 | 18525 | -1.525 | -0.3606 | Yes | ||
| 43 | PADI2 | 2940092 6420136 | 18593 | -2.691 | -0.2284 | Yes | ||
| 44 | ARHGEF1 | 610347 4850603 6420672 | 18612 | -4.545 | 0.0002 | Yes |