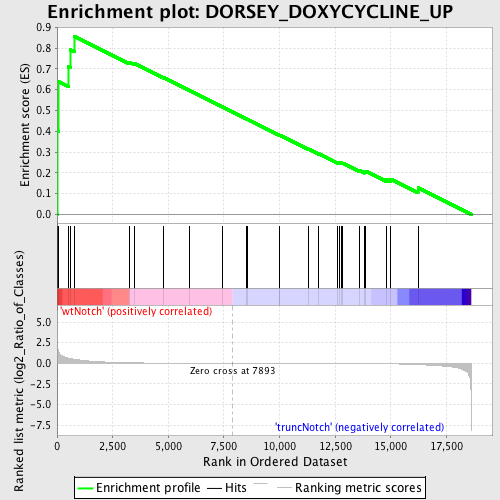
Profile of the Running ES Score & Positions of GeneSet Members on the Rank Ordered List
| Dataset | Set_03_wtNotch_versus_truncNotch.phenotype_wtNotch_versus_truncNotch.cls #wtNotch_versus_truncNotch.phenotype_wtNotch_versus_truncNotch.cls #wtNotch_versus_truncNotch_repos |
| Phenotype | phenotype_wtNotch_versus_truncNotch.cls#wtNotch_versus_truncNotch_repos |
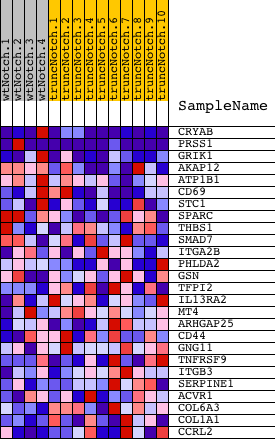
| Upregulated in class | wtNotch |
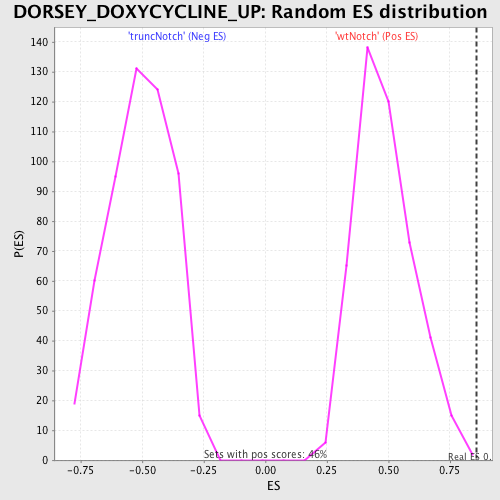
| GeneSet | DORSEY_DOXYCYCLINE_UP |
| Enrichment Score (ES) | 0.8573142 |
| Normalized Enrichment Score (NES) | 1.7619108 |
| Nominal p-value | 0.002173913 |
| FDR q-value | 0.04750498 |
| FWER p-Value | 0.123 |
| PROBE | DESCRIPTION (from dataset) | GENE SYMBOL | GENE_TITLE | RANK IN GENE LIST | RANK METRIC SCORE | RUNNING ES | CORE ENRICHMENT | |
|---|---|---|---|---|---|---|---|---|
| 1 | CRYAB | 4810619 | 9 | 2.602 | 0.4019 | Yes | ||
| 2 | PRSS1 | 5860044 | 57 | 1.545 | 0.6383 | Yes | ||
| 3 | GRIK1 | 1500707 6020463 | 506 | 0.617 | 0.7097 | Yes | ||
| 4 | AKAP12 | 1450739 | 606 | 0.561 | 0.7911 | Yes | ||
| 5 | ATP1B1 | 3130594 | 766 | 0.483 | 0.8573 | Yes | ||
| 6 | CD69 | 380167 4730088 | 3256 | 0.052 | 0.7315 | No | ||
| 7 | STC1 | 360161 | 3464 | 0.043 | 0.7271 | No | ||
| 8 | SPARC | 1690086 | 4792 | 0.015 | 0.6579 | No | ||
| 9 | THBS1 | 4560494 430288 | 5957 | 0.007 | 0.5963 | No | ||
| 10 | SMAD7 | 430377 | 7414 | 0.001 | 0.5182 | No | ||
| 11 | ITGA2B | 2680538 | 8504 | -0.002 | 0.4599 | No | ||
| 12 | PHLDA2 | 4810494 | 8570 | -0.002 | 0.4567 | No | ||
| 13 | GSN | 3830168 | 9984 | -0.006 | 0.3817 | No | ||
| 14 | TFPI2 | 3870324 | 10009 | -0.006 | 0.3814 | No | ||
| 15 | IL13RA2 | 2190577 | 11285 | -0.011 | 0.3145 | No | ||
| 16 | MT4 | 4780338 | 11751 | -0.014 | 0.2917 | No | ||
| 17 | ARHGAP25 | 5080373 | 12609 | -0.021 | 0.2488 | No | ||
| 18 | CD44 | 3990072 4850671 5860411 6860148 7050551 | 12698 | -0.022 | 0.2474 | No | ||
| 19 | GNG11 | 4010142 | 12763 | -0.022 | 0.2474 | No | ||
| 20 | TNFRSF9 | 2510400 6650484 | 12846 | -0.023 | 0.2466 | No | ||
| 21 | ITGB3 | 5270463 | 13603 | -0.034 | 0.2111 | No | ||
| 22 | SERPINE1 | 4210403 | 13832 | -0.038 | 0.2047 | No | ||
| 23 | ACVR1 | 6840671 | 13878 | -0.039 | 0.2083 | No | ||
| 24 | COL6A3 | 2640717 4070064 5390717 | 14797 | -0.064 | 0.1687 | No | ||
| 25 | COL1A1 | 730020 | 14999 | -0.071 | 0.1689 | No | ||
| 26 | CCRL2 | 4760471 | 16224 | -0.165 | 0.1287 | No |