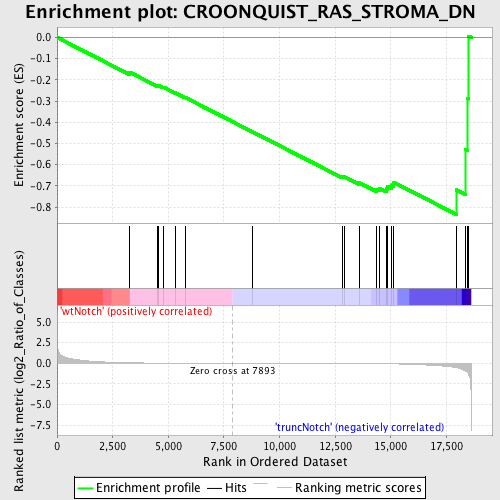
Profile of the Running ES Score & Positions of GeneSet Members on the Rank Ordered List
| Dataset | Set_03_wtNotch_versus_truncNotch.phenotype_wtNotch_versus_truncNotch.cls #wtNotch_versus_truncNotch.phenotype_wtNotch_versus_truncNotch.cls #wtNotch_versus_truncNotch_repos |
| Phenotype | phenotype_wtNotch_versus_truncNotch.cls#wtNotch_versus_truncNotch_repos |
| Upregulated in class | truncNotch |
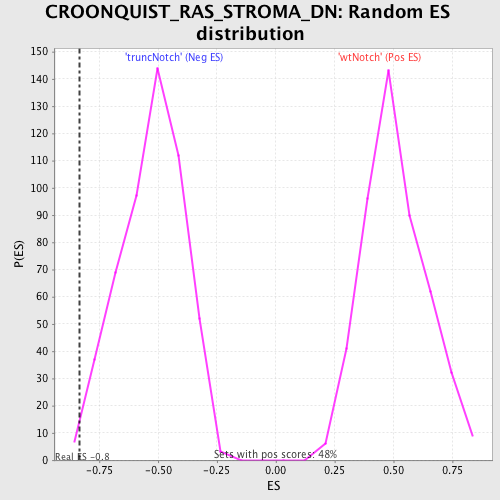
| GeneSet | CROONQUIST_RAS_STROMA_DN |
| Enrichment Score (ES) | -0.83469737 |
| Normalized Enrichment Score (NES) | -1.5836184 |
| Nominal p-value | 0.007677543 |
| FDR q-value | 0.24433282 |
| FWER p-Value | 0.988 |
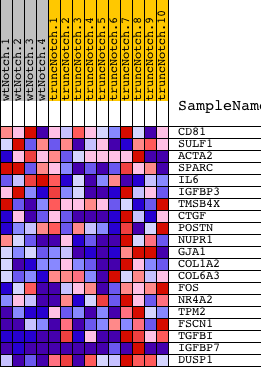
| PROBE | DESCRIPTION (from dataset) | GENE SYMBOL | GENE_TITLE | RANK IN GENE LIST | RANK METRIC SCORE | RUNNING ES | CORE ENRICHMENT | |
|---|---|---|---|---|---|---|---|---|
| 1 | CD81 | 5270093 | 3266 | 0.051 | -0.1642 | No | ||
| 2 | SULF1 | 430575 | 4529 | 0.018 | -0.2282 | No | ||
| 3 | ACTA2 | 60008 1230082 | 4559 | 0.017 | -0.2259 | No | ||
| 4 | SPARC | 1690086 | 4792 | 0.015 | -0.2352 | No | ||
| 5 | IL6 | 380133 | 5316 | 0.010 | -0.2610 | No | ||
| 6 | IGFBP3 | 2370500 | 5749 | 0.008 | -0.2826 | No | ||
| 7 | TMSB4X | 6620114 | 8770 | -0.002 | -0.4444 | No | ||
| 8 | CTGF | 4540577 | 12821 | -0.023 | -0.6571 | No | ||
| 9 | POSTN | 450411 6040451 | 12913 | -0.024 | -0.6567 | No | ||
| 10 | NUPR1 | 1990524 | 13595 | -0.033 | -0.6859 | No | ||
| 11 | GJA1 | 5220731 | 14358 | -0.049 | -0.7160 | No | ||
| 12 | COL1A2 | 380364 | 14505 | -0.054 | -0.7118 | No | ||
| 13 | COL6A3 | 2640717 4070064 5390717 | 14797 | -0.064 | -0.7134 | No | ||
| 14 | FOS | 1850315 | 14838 | -0.065 | -0.7011 | No | ||
| 15 | NR4A2 | 60273 | 15039 | -0.073 | -0.6956 | No | ||
| 16 | TPM2 | 520735 3870390 | 15138 | -0.078 | -0.6836 | No | ||
| 17 | FSCN1 | 3450463 | 17949 | -0.522 | -0.7189 | Yes | ||
| 18 | TGFBI | 2060446 6900112 | 18366 | -0.957 | -0.5289 | Yes | ||
| 19 | IGFBP7 | 520411 3060110 5290152 | 18450 | -1.108 | -0.2876 | Yes | ||
| 20 | DUSP1 | 6860121 | 18501 | -1.337 | 0.0062 | Yes |