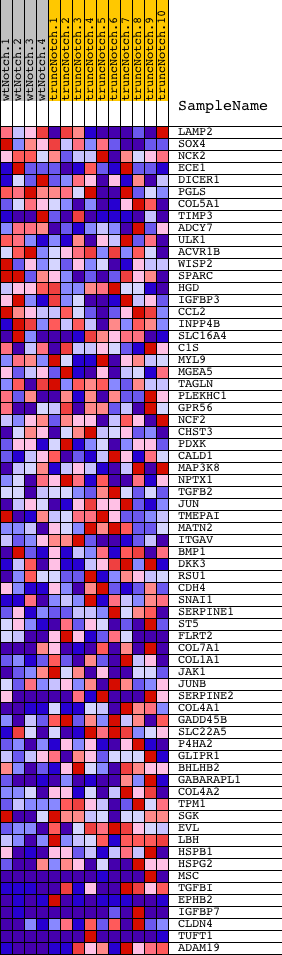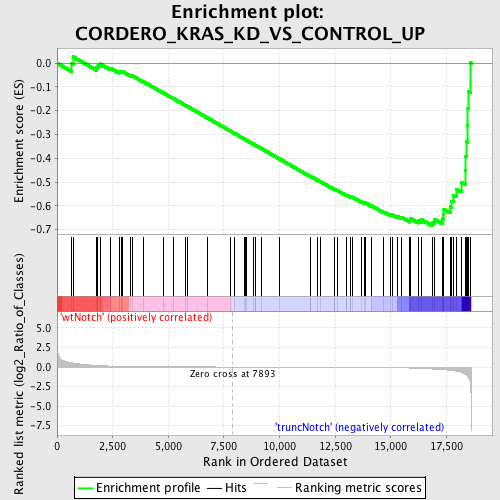
Profile of the Running ES Score & Positions of GeneSet Members on the Rank Ordered List
| Dataset | Set_03_wtNotch_versus_truncNotch.phenotype_wtNotch_versus_truncNotch.cls #wtNotch_versus_truncNotch.phenotype_wtNotch_versus_truncNotch.cls #wtNotch_versus_truncNotch_repos |
| Phenotype | phenotype_wtNotch_versus_truncNotch.cls#wtNotch_versus_truncNotch_repos |
| Upregulated in class | truncNotch |
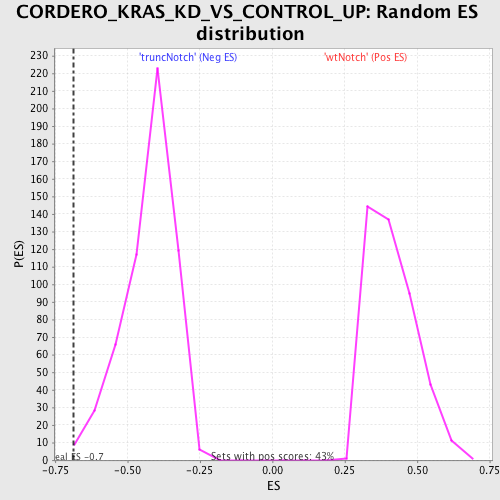
| GeneSet | CORDERO_KRAS_KD_VS_CONTROL_UP |
| Enrichment Score (ES) | -0.68479145 |
| Normalized Enrichment Score (NES) | -1.6040286 |
| Nominal p-value | 0.00528169 |
| FDR q-value | 0.2082258 |
| FWER p-Value | 0.954 |
| PROBE | DESCRIPTION (from dataset) | GENE SYMBOL | GENE_TITLE | RANK IN GENE LIST | RANK METRIC SCORE | RUNNING ES | CORE ENRICHMENT | |
|---|---|---|---|---|---|---|---|---|
| 1 | LAMP2 | 1230402 1980373 | 645 | 0.540 | -0.0011 | No | ||
| 2 | SOX4 | 2260091 | 720 | 0.506 | 0.0265 | No | ||
| 3 | NCK2 | 2510010 | 1764 | 0.206 | -0.0168 | No | ||
| 4 | ECE1 | 3870093 3940551 | 1836 | 0.192 | -0.0086 | No | ||
| 5 | DICER1 | 540286 | 1944 | 0.176 | -0.0034 | No | ||
| 6 | PGLS | 2120324 | 2408 | 0.115 | -0.0212 | No | ||
| 7 | COL5A1 | 2230050 | 2785 | 0.084 | -0.0363 | No | ||
| 8 | TIMP3 | 1450504 1980270 | 2872 | 0.077 | -0.0361 | No | ||
| 9 | ADCY7 | 6290520 7560739 | 2947 | 0.071 | -0.0357 | No | ||
| 10 | ULK1 | 6100315 | 3313 | 0.049 | -0.0523 | No | ||
| 11 | ACVR1B | 3610446 5570195 | 3377 | 0.047 | -0.0528 | No | ||
| 12 | WISP2 | 5550411 | 3877 | 0.030 | -0.0778 | No | ||
| 13 | SPARC | 1690086 | 4792 | 0.015 | -0.1262 | No | ||
| 14 | HGD | 460390 | 5221 | 0.011 | -0.1486 | No | ||
| 15 | IGFBP3 | 2370500 | 5749 | 0.008 | -0.1765 | No | ||
| 16 | CCL2 | 4760019 | 5845 | 0.007 | -0.1812 | No | ||
| 17 | INPP4B | 6200504 | 6760 | 0.003 | -0.2303 | No | ||
| 18 | SLC16A4 | 2450500 | 7793 | 0.000 | -0.2859 | No | ||
| 19 | C1S | 840184 6840114 | 7990 | -0.000 | -0.2964 | No | ||
| 20 | MYL9 | 4210750 7050138 | 8441 | -0.002 | -0.3206 | No | ||
| 21 | MGEA5 | 6100014 | 8457 | -0.002 | -0.3213 | No | ||
| 22 | TAGLN | 6660280 | 8527 | -0.002 | -0.3249 | No | ||
| 23 | PLEKHC1 | 2650066 | 8833 | -0.003 | -0.3412 | No | ||
| 24 | GPR56 | 1190494 | 8917 | -0.003 | -0.3455 | No | ||
| 25 | NCF2 | 540129 2370441 2650133 | 8921 | -0.003 | -0.3455 | No | ||
| 26 | CHST3 | 2370131 | 9173 | -0.004 | -0.3588 | No | ||
| 27 | PDXK | 6840066 | 9993 | -0.006 | -0.4026 | No | ||
| 28 | CALD1 | 1770129 1940397 | 11382 | -0.012 | -0.4766 | No | ||
| 29 | MAP3K8 | 2940286 | 11391 | -0.012 | -0.4763 | No | ||
| 30 | NPTX1 | 3710736 | 11686 | -0.014 | -0.4913 | No | ||
| 31 | TGFB2 | 4920292 | 11832 | -0.015 | -0.4982 | No | ||
| 32 | JUN | 840170 | 12454 | -0.019 | -0.5305 | No | ||
| 33 | TMEPAI | 1340253 | 12487 | -0.020 | -0.5310 | No | ||
| 34 | MATN2 | 460215 | 12597 | -0.021 | -0.5356 | No | ||
| 35 | ITGAV | 2340020 | 13025 | -0.025 | -0.5570 | No | ||
| 36 | BMP1 | 380594 2940576 3710593 | 13029 | -0.025 | -0.5556 | No | ||
| 37 | DKK3 | 6450072 7050128 | 13173 | -0.027 | -0.5616 | No | ||
| 38 | RSU1 | 4850372 | 13198 | -0.027 | -0.5612 | No | ||
| 39 | CDH4 | 6550368 | 13298 | -0.029 | -0.5648 | No | ||
| 40 | SNAI1 | 6590253 | 13687 | -0.035 | -0.5835 | No | ||
| 41 | SERPINE1 | 4210403 | 13832 | -0.038 | -0.5889 | No | ||
| 42 | ST5 | 3780204 | 13845 | -0.038 | -0.5872 | No | ||
| 43 | FLRT2 | 4200035 | 14137 | -0.044 | -0.6001 | No | ||
| 44 | COL7A1 | 1230168 2190072 | 14692 | -0.060 | -0.6262 | No | ||
| 45 | COL1A1 | 730020 | 14999 | -0.071 | -0.6383 | No | ||
| 46 | JAK1 | 5910746 | 15058 | -0.074 | -0.6368 | No | ||
| 47 | JUNB | 4230048 | 15318 | -0.088 | -0.6453 | No | ||
| 48 | SERPINE2 | 2810390 | 15499 | -0.100 | -0.6487 | No | ||
| 49 | COL4A1 | 1740575 | 15860 | -0.127 | -0.6602 | No | ||
| 50 | GADD45B | 2350408 | 15876 | -0.128 | -0.6530 | No | ||
| 51 | SLC22A5 | 2510358 2510451 | 16235 | -0.166 | -0.6620 | No | ||
| 52 | P4HA2 | 1090546 | 16387 | -0.186 | -0.6585 | No | ||
| 53 | GLIPR1 | 3360750 | 16876 | -0.255 | -0.6689 | Yes | ||
| 54 | BHLHB2 | 7040603 | 16979 | -0.269 | -0.6576 | Yes | ||
| 55 | GABARAPL1 | 2810458 | 17321 | -0.336 | -0.6550 | Yes | ||
| 56 | COL4A2 | 2350619 | 17381 | -0.348 | -0.6365 | Yes | ||
| 57 | TPM1 | 130673 | 17387 | -0.349 | -0.6150 | Yes | ||
| 58 | SGK | 1400131 2480056 | 17670 | -0.418 | -0.6041 | Yes | ||
| 59 | EVL | 1740113 | 17734 | -0.441 | -0.5799 | Yes | ||
| 60 | LBH | 70093 | 17802 | -0.463 | -0.5546 | Yes | ||
| 61 | HSPB1 | 6760435 | 17935 | -0.518 | -0.5294 | Yes | ||
| 62 | HSPG2 | 2510687 6220750 | 18163 | -0.669 | -0.4999 | Yes | ||
| 63 | MSC | 5080139 | 18354 | -0.940 | -0.4515 | Yes | ||
| 64 | TGFBI | 2060446 6900112 | 18366 | -0.957 | -0.3923 | Yes | ||
| 65 | EPHB2 | 1090288 1410377 2100541 | 18409 | -1.036 | -0.3299 | Yes | ||
| 66 | IGFBP7 | 520411 3060110 5290152 | 18450 | -1.108 | -0.2629 | Yes | ||
| 67 | CLDN4 | 4920739 | 18465 | -1.162 | -0.1911 | Yes | ||
| 68 | TUFT1 | 540047 2370010 | 18473 | -1.181 | -0.1177 | Yes | ||
| 69 | ADAM19 | 5340075 | 18565 | -2.009 | 0.0027 | Yes |