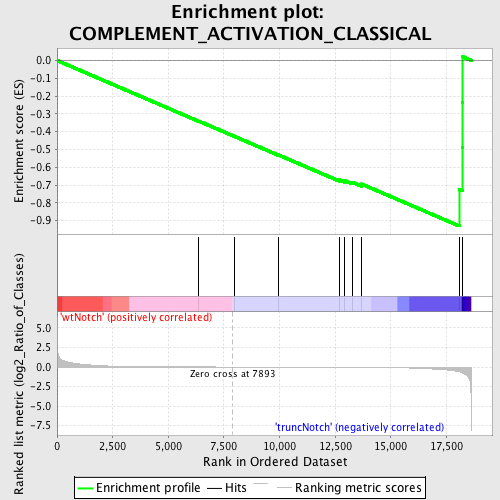
Profile of the Running ES Score & Positions of GeneSet Members on the Rank Ordered List
| Dataset | Set_03_wtNotch_versus_truncNotch.phenotype_wtNotch_versus_truncNotch.cls #wtNotch_versus_truncNotch.phenotype_wtNotch_versus_truncNotch.cls #wtNotch_versus_truncNotch_repos |
| Phenotype | phenotype_wtNotch_versus_truncNotch.cls#wtNotch_versus_truncNotch_repos |
| Upregulated in class | truncNotch |
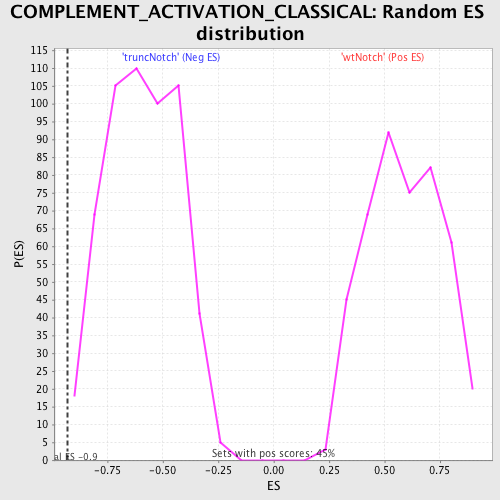
| GeneSet | COMPLEMENT_ACTIVATION_CLASSICAL |
| Enrichment Score (ES) | -0.93005735 |
| Normalized Enrichment Score (NES) | -1.5723629 |
| Nominal p-value | 0.0018083183 |
| FDR q-value | 0.26289627 |
| FWER p-Value | 0.995 |
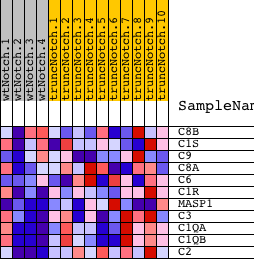
| PROBE | DESCRIPTION (from dataset) | GENE SYMBOL | GENE_TITLE | RANK IN GENE LIST | RANK METRIC SCORE | RUNNING ES | CORE ENRICHMENT | |
|---|---|---|---|---|---|---|---|---|
| 1 | C8B | 6770687 | 6360 | 0.005 | -0.3402 | No | ||
| 2 | C1S | 840184 6840114 | 7990 | -0.000 | -0.4276 | No | ||
| 3 | C9 | 5550452 5690253 | 9934 | -0.006 | -0.5300 | No | ||
| 4 | C8A | 2190601 | 12682 | -0.021 | -0.6703 | No | ||
| 5 | C6 | 1770154 2900129 | 12927 | -0.024 | -0.6753 | No | ||
| 6 | C1R | 2340025 3290152 4850452 | 13264 | -0.028 | -0.6837 | No | ||
| 7 | MASP1 | 1780619 2900066 | 13681 | -0.035 | -0.6941 | No | ||
| 8 | C3 | 1740372 | 18072 | -0.599 | -0.7260 | Yes | ||
| 9 | C1QA | 5390687 | 18209 | -0.722 | -0.4875 | Yes | ||
| 10 | C1QB | 5910292 | 18220 | -0.735 | -0.2377 | Yes | ||
| 11 | C2 | 5390465 | 18238 | -0.760 | 0.0203 | Yes |