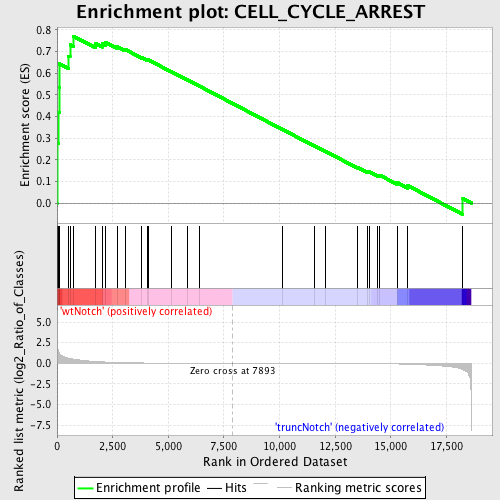
Profile of the Running ES Score & Positions of GeneSet Members on the Rank Ordered List
| Dataset | Set_03_wtNotch_versus_truncNotch.phenotype_wtNotch_versus_truncNotch.cls #wtNotch_versus_truncNotch.phenotype_wtNotch_versus_truncNotch.cls #wtNotch_versus_truncNotch_repos |
| Phenotype | phenotype_wtNotch_versus_truncNotch.cls#wtNotch_versus_truncNotch_repos |
| Upregulated in class | wtNotch |
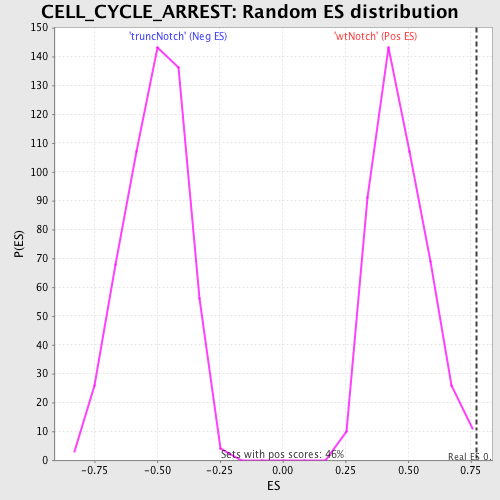
| GeneSet | CELL_CYCLE_ARREST |
| Enrichment Score (ES) | 0.77088624 |
| Normalized Enrichment Score (NES) | 1.6441058 |
| Nominal p-value | 0.0065645515 |
| FDR q-value | 0.14803477 |
| FWER p-Value | 0.832 |
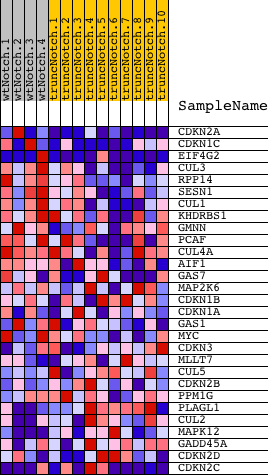
| PROBE | DESCRIPTION (from dataset) | GENE SYMBOL | GENE_TITLE | RANK IN GENE LIST | RANK METRIC SCORE | RUNNING ES | CORE ENRICHMENT | |
|---|---|---|---|---|---|---|---|---|
| 1 | CDKN2A | 4670215 4760047 | 4 | 2.884 | 0.2756 | Yes | ||
| 2 | CDKN1C | 6520577 | 59 | 1.527 | 0.4188 | Yes | ||
| 3 | EIF4G2 | 3800575 6860184 | 94 | 1.204 | 0.5321 | Yes | ||
| 4 | CUL3 | 1850520 | 102 | 1.160 | 0.6427 | Yes | ||
| 5 | RPP14 | 7040014 | 520 | 0.612 | 0.6788 | Yes | ||
| 6 | SESN1 | 2120021 | 582 | 0.573 | 0.7303 | Yes | ||
| 7 | CUL1 | 1990632 | 723 | 0.503 | 0.7709 | Yes | ||
| 8 | KHDRBS1 | 1240403 6040040 | 1715 | 0.215 | 0.7382 | No | ||
| 9 | GMNN | 2630148 | 2046 | 0.161 | 0.7358 | No | ||
| 10 | PCAF | 2230161 2570369 6550451 | 2173 | 0.142 | 0.7425 | No | ||
| 11 | CUL4A | 1170088 2320008 2470278 | 2727 | 0.087 | 0.7211 | No | ||
| 12 | AIF1 | 130332 5220017 | 3066 | 0.064 | 0.7090 | No | ||
| 13 | GAS7 | 2120358 6450494 | 3807 | 0.031 | 0.6722 | No | ||
| 14 | MAP2K6 | 1230056 2940204 | 4081 | 0.025 | 0.6599 | No | ||
| 15 | CDKN1B | 3800025 6450044 | 4101 | 0.024 | 0.6612 | No | ||
| 16 | CDKN1A | 4050088 6400706 | 5145 | 0.011 | 0.6062 | No | ||
| 17 | GAS1 | 2120504 | 5882 | 0.007 | 0.5672 | No | ||
| 18 | MYC | 380541 4670170 | 6391 | 0.005 | 0.5404 | No | ||
| 19 | CDKN3 | 110520 | 10122 | -0.007 | 0.3403 | No | ||
| 20 | MLLT7 | 4480707 | 11566 | -0.013 | 0.2639 | No | ||
| 21 | CUL5 | 450142 | 12054 | -0.016 | 0.2393 | No | ||
| 22 | CDKN2B | 6020040 | 13499 | -0.032 | 0.1646 | No | ||
| 23 | PPM1G | 610725 | 13957 | -0.040 | 0.1439 | No | ||
| 24 | PLAGL1 | 3190082 6200193 | 14019 | -0.041 | 0.1445 | No | ||
| 25 | CUL2 | 4200278 | 14400 | -0.051 | 0.1289 | No | ||
| 26 | MAPK12 | 450022 1340717 7050484 | 14503 | -0.054 | 0.1286 | No | ||
| 27 | GADD45A | 2900717 | 15292 | -0.086 | 0.0945 | No | ||
| 28 | CDKN2D | 6040035 | 15762 | -0.118 | 0.0805 | No | ||
| 29 | CDKN2C | 5050750 5130148 | 18240 | -0.763 | 0.0202 | No |