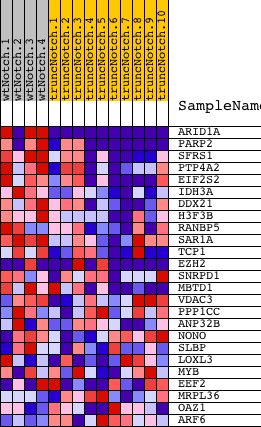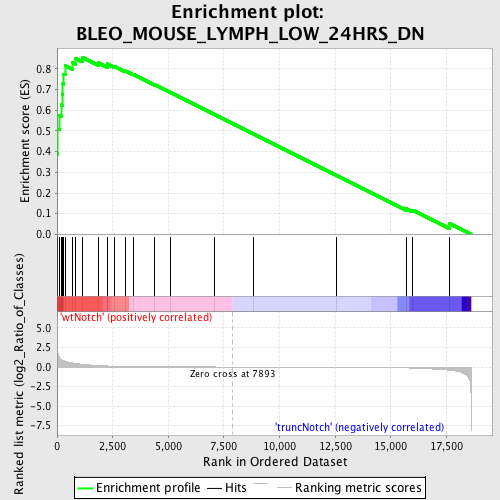
Profile of the Running ES Score & Positions of GeneSet Members on the Rank Ordered List
| Dataset | Set_03_wtNotch_versus_truncNotch.phenotype_wtNotch_versus_truncNotch.cls #wtNotch_versus_truncNotch.phenotype_wtNotch_versus_truncNotch.cls #wtNotch_versus_truncNotch_repos |
| Phenotype | phenotype_wtNotch_versus_truncNotch.cls#wtNotch_versus_truncNotch_repos |
| Upregulated in class | wtNotch |
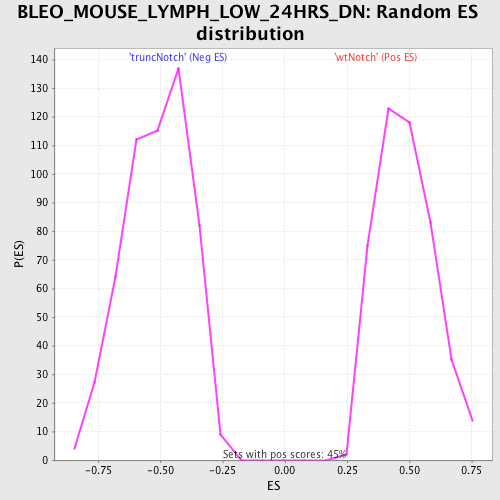
| GeneSet | BLEO_MOUSE_LYMPH_LOW_24HRS_DN |
| Enrichment Score (ES) | 0.85545313 |
| Normalized Enrichment Score (NES) | 1.7663013 |
| Nominal p-value | 0.0 |
| FDR q-value | 0.06026648 |
| FWER p-Value | 0.106 |
| PROBE | DESCRIPTION (from dataset) | GENE SYMBOL | GENE_TITLE | RANK IN GENE LIST | RANK METRIC SCORE | RUNNING ES | CORE ENRICHMENT | |
|---|---|---|---|---|---|---|---|---|
| 1 | ARID1A | 2630022 1690551 4810110 | 0 | 6.327 | 0.3890 | Yes | ||
| 2 | PARP2 | 4920039 6510097 1500750 | 22 | 1.968 | 0.5089 | Yes | ||
| 3 | SFRS1 | 2360440 | 108 | 1.134 | 0.5741 | Yes | ||
| 4 | PTP4A2 | 870154 6040070 6130242 6760224 | 199 | 0.915 | 0.6255 | Yes | ||
| 5 | EIF2S2 | 770095 2810487 | 224 | 0.876 | 0.6781 | Yes | ||
| 6 | IDH3A | 460332 | 261 | 0.833 | 0.7274 | Yes | ||
| 7 | DDX21 | 6100446 | 292 | 0.788 | 0.7742 | Yes | ||
| 8 | H3F3B | 1410300 | 359 | 0.727 | 0.8153 | Yes | ||
| 9 | RANBP5 | 3780019 | 700 | 0.514 | 0.8286 | Yes | ||
| 10 | SAR1A | 3450253 | 831 | 0.458 | 0.8498 | Yes | ||
| 11 | TCP1 | 2450100 5130524 | 1130 | 0.352 | 0.8555 | Yes | ||
| 12 | EZH2 | 6130605 6380524 | 1852 | 0.189 | 0.8283 | No | ||
| 13 | SNRPD1 | 4480162 | 2249 | 0.133 | 0.8152 | No | ||
| 14 | MBTD1 | 5910400 | 2250 | 0.132 | 0.8233 | No | ||
| 15 | VDAC3 | 5390088 | 2585 | 0.099 | 0.8114 | No | ||
| 16 | PPP1CC | 6380300 2510647 | 3072 | 0.063 | 0.7891 | No | ||
| 17 | ANP32B | 940095 2450494 4200368 | 3431 | 0.045 | 0.7726 | No | ||
| 18 | NONO | 7050014 | 4395 | 0.019 | 0.7220 | No | ||
| 19 | SLBP | 6220601 | 5090 | 0.012 | 0.6854 | No | ||
| 20 | LOXL3 | 4010168 | 7066 | 0.002 | 0.5794 | No | ||
| 21 | MYB | 1660494 5860451 6130706 | 8839 | -0.003 | 0.4842 | No | ||
| 22 | EEF2 | 1050369 4670035 5890598 | 12561 | -0.020 | 0.2853 | No | ||
| 23 | MRPL36 | 1450048 | 15690 | -0.112 | 0.1240 | No | ||
| 24 | OAZ1 | 110181 | 15967 | -0.138 | 0.1176 | No | ||
| 25 | ARF6 | 3520026 | 17622 | -0.404 | 0.0535 | No |