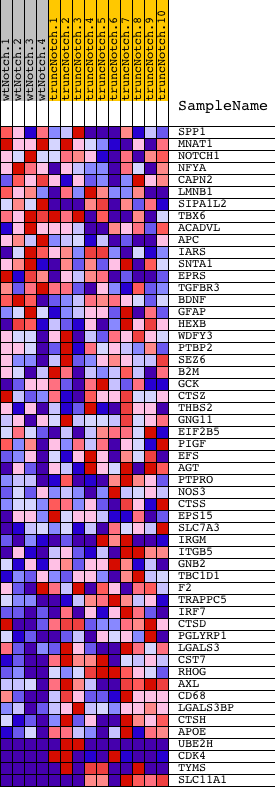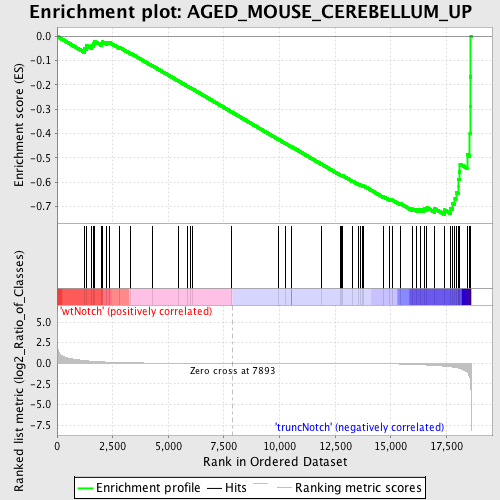
Profile of the Running ES Score & Positions of GeneSet Members on the Rank Ordered List
| Dataset | Set_03_wtNotch_versus_truncNotch.phenotype_wtNotch_versus_truncNotch.cls #wtNotch_versus_truncNotch.phenotype_wtNotch_versus_truncNotch.cls #wtNotch_versus_truncNotch_repos |
| Phenotype | phenotype_wtNotch_versus_truncNotch.cls#wtNotch_versus_truncNotch_repos |
| Upregulated in class | truncNotch |
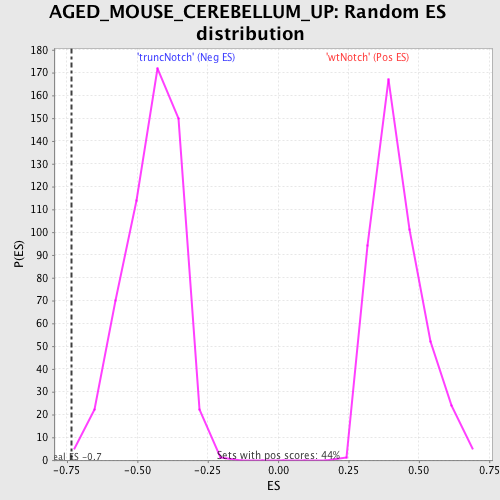
| GeneSet | AGED_MOUSE_CEREBELLUM_UP |
| Enrichment Score (ES) | -0.7330691 |
| Normalized Enrichment Score (NES) | -1.6456385 |
| Nominal p-value | 0.0017985612 |
| FDR q-value | 0.19781397 |
| FWER p-Value | 0.723 |
| PROBE | DESCRIPTION (from dataset) | GENE SYMBOL | GENE_TITLE | RANK IN GENE LIST | RANK METRIC SCORE | RUNNING ES | CORE ENRICHMENT | |
|---|---|---|---|---|---|---|---|---|
| 1 | SPP1 | 2470609 | 1223 | 0.329 | -0.0485 | No | ||
| 2 | MNAT1 | 730292 2350364 | 1327 | 0.300 | -0.0382 | No | ||
| 3 | NOTCH1 | 3390114 | 1563 | 0.243 | -0.0381 | No | ||
| 4 | NFYA | 5860368 | 1629 | 0.229 | -0.0294 | No | ||
| 5 | CAPN2 | 430687 2360601 6980609 | 1688 | 0.219 | -0.0210 | No | ||
| 6 | LMNB1 | 5890292 6020008 | 2007 | 0.167 | -0.0293 | No | ||
| 7 | SIPA1L2 | 4850731 | 2031 | 0.163 | -0.0219 | No | ||
| 8 | TBX6 | 4730139 6840647 | 2237 | 0.134 | -0.0259 | No | ||
| 9 | ACADVL | 6040403 | 2332 | 0.123 | -0.0245 | No | ||
| 10 | APC | 3850484 5860722 | 2799 | 0.082 | -0.0452 | No | ||
| 11 | IARS | 460528 1580739 1690008 | 3317 | 0.049 | -0.0705 | No | ||
| 12 | SNTA1 | 4570400 | 4284 | 0.021 | -0.1214 | No | ||
| 13 | EPRS | 3170301 | 5435 | 0.009 | -0.1828 | No | ||
| 14 | TGFBR3 | 5290577 | 5857 | 0.007 | -0.2052 | No | ||
| 15 | BDNF | 2940128 3520368 | 5977 | 0.007 | -0.2112 | No | ||
| 16 | GFAP | 2060092 | 6098 | 0.006 | -0.2174 | No | ||
| 17 | HEXB | 5860692 | 7837 | 0.000 | -0.3110 | No | ||
| 18 | WDFY3 | 3610041 4560333 4570273 | 9963 | -0.006 | -0.4252 | No | ||
| 19 | PTBP2 | 1240398 | 10262 | -0.007 | -0.4408 | No | ||
| 20 | SEZ6 | 3450722 | 10535 | -0.008 | -0.4551 | No | ||
| 21 | B2M | 5080332 5130059 | 10543 | -0.008 | -0.4550 | No | ||
| 22 | GCK | 2370273 | 10553 | -0.008 | -0.4551 | No | ||
| 23 | CTSZ | 1500687 1690364 | 11868 | -0.015 | -0.5251 | No | ||
| 24 | THBS2 | 2850136 | 12748 | -0.022 | -0.5713 | No | ||
| 25 | GNG11 | 4010142 | 12763 | -0.022 | -0.5708 | No | ||
| 26 | EIF2B5 | 430315 6900400 | 12843 | -0.023 | -0.5739 | No | ||
| 27 | PIGF | 5690050 | 13291 | -0.029 | -0.5964 | No | ||
| 28 | EFS | 110288 | 13543 | -0.033 | -0.6082 | No | ||
| 29 | AGT | 7000575 | 13628 | -0.034 | -0.6109 | No | ||
| 30 | PTPRO | 1940576 6370332 | 13738 | -0.036 | -0.6149 | No | ||
| 31 | NOS3 | 630152 670465 | 13791 | -0.037 | -0.6158 | No | ||
| 32 | CTSS | 1740056 | 14673 | -0.059 | -0.6601 | No | ||
| 33 | EPS15 | 4200215 | 14942 | -0.069 | -0.6709 | No | ||
| 34 | SLC7A3 | 60270 1400091 | 15061 | -0.074 | -0.6733 | No | ||
| 35 | IRGM | 6110148 6660685 | 15434 | -0.096 | -0.6883 | No | ||
| 36 | ITGB5 | 70129 | 15977 | -0.139 | -0.7102 | No | ||
| 37 | GNB2 | 2350053 | 16175 | -0.159 | -0.7124 | No | ||
| 38 | TBC1D1 | 2510072 | 16339 | -0.180 | -0.7117 | No | ||
| 39 | F2 | 5720280 | 16493 | -0.199 | -0.7094 | No | ||
| 40 | TRAPPC5 | 2320315 | 16625 | -0.218 | -0.7049 | No | ||
| 41 | IRF7 | 1570605 | 16971 | -0.268 | -0.7094 | No | ||
| 42 | CTSD | 1070195 | 17412 | -0.353 | -0.7144 | Yes | ||
| 43 | PGLYRP1 | 6760242 | 17687 | -0.423 | -0.7068 | Yes | ||
| 44 | LGALS3 | 2120239 | 17764 | -0.451 | -0.6870 | Yes | ||
| 45 | CST7 | 380369 | 17881 | -0.495 | -0.6671 | Yes | ||
| 46 | RHOG | 6760575 | 17932 | -0.516 | -0.6426 | Yes | ||
| 47 | AXL | 1770095 | 18039 | -0.577 | -0.6178 | Yes | ||
| 48 | CD68 | 6350450 | 18041 | -0.578 | -0.5873 | Yes | ||
| 49 | LGALS3BP | 840692 | 18081 | -0.606 | -0.5574 | Yes | ||
| 50 | CTSH | 60524 | 18108 | -0.625 | -0.5258 | Yes | ||
| 51 | APOE | 4200671 | 18429 | -1.072 | -0.4863 | Yes | ||
| 52 | UBE2H | 1980142 2970079 | 18556 | -1.747 | -0.4008 | Yes | ||
| 53 | CDK4 | 540075 4540600 | 18574 | -2.101 | -0.2907 | Yes | ||
| 54 | TYMS | 940450 1940068 3710008 5570546 | 18578 | -2.352 | -0.1665 | Yes | ||
| 55 | SLC11A1 | 940286 2810435 6370647 | 18601 | -3.189 | 0.0008 | Yes |