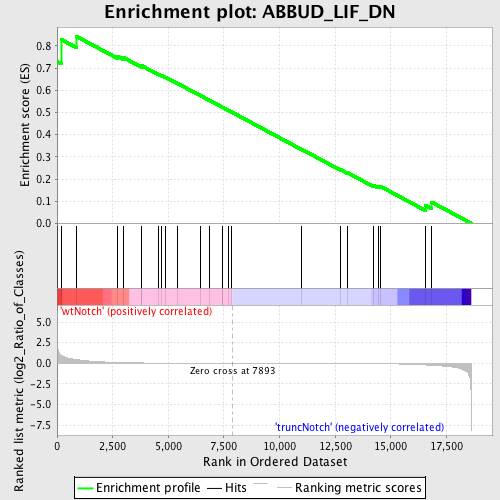
Profile of the Running ES Score & Positions of GeneSet Members on the Rank Ordered List
| Dataset | Set_03_wtNotch_versus_truncNotch.phenotype_wtNotch_versus_truncNotch.cls #wtNotch_versus_truncNotch.phenotype_wtNotch_versus_truncNotch.cls #wtNotch_versus_truncNotch_repos |
| Phenotype | phenotype_wtNotch_versus_truncNotch.cls#wtNotch_versus_truncNotch_repos |
| Upregulated in class | wtNotch |
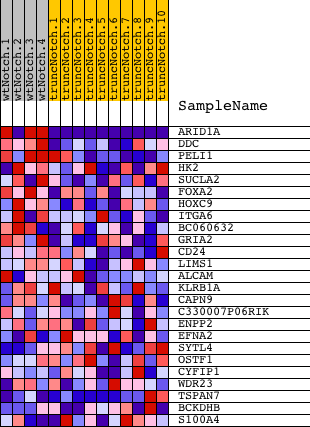
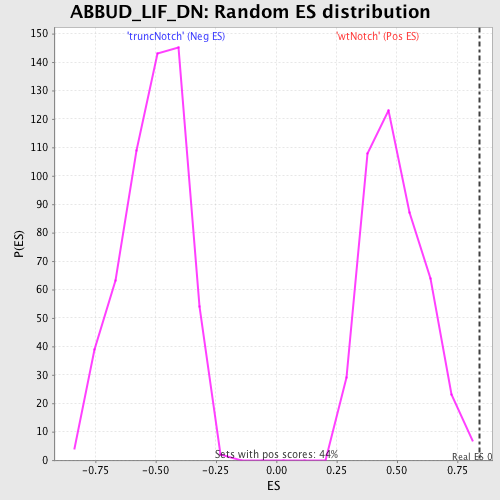
| GeneSet | ABBUD_LIF_DN |
| Enrichment Score (ES) | 0.8426121 |
| Normalized Enrichment Score (NES) | 1.710976 |
| Nominal p-value | 0.0022675737 |
| FDR q-value | 0.10135037 |
| FWER p-Value | 0.364 |
| PROBE | DESCRIPTION (from dataset) | GENE SYMBOL | GENE_TITLE | RANK IN GENE LIST | RANK METRIC SCORE | RUNNING ES | CORE ENRICHMENT | |
|---|---|---|---|---|---|---|---|---|
| 1 | ARID1A | 2630022 1690551 4810110 | 0 | 6.327 | 0.7299 | Yes | ||
| 2 | DDC | 670408 | 179 | 0.948 | 0.8297 | Yes | ||
| 3 | PELI1 | 3870215 6900040 | 881 | 0.439 | 0.8426 | Yes | ||
| 4 | HK2 | 2640722 | 2725 | 0.087 | 0.7536 | No | ||
| 5 | SUCLA2 | 730632 1170292 | 2969 | 0.070 | 0.7486 | No | ||
| 6 | FOXA2 | 540338 5860441 | 3804 | 0.032 | 0.7073 | No | ||
| 7 | HOXC9 | 1570040 | 3814 | 0.031 | 0.7105 | No | ||
| 8 | ITGA6 | 3830129 | 4560 | 0.017 | 0.6724 | No | ||
| 9 | BC060632 | 540091 | 4705 | 0.016 | 0.6664 | No | ||
| 10 | GRIA2 | 5080088 | 4853 | 0.014 | 0.6601 | No | ||
| 11 | CD24 | 1780091 | 5389 | 0.010 | 0.6325 | No | ||
| 12 | LIMS1 | 110138 1450398 | 6444 | 0.005 | 0.5763 | No | ||
| 13 | ALCAM | 1050019 | 6834 | 0.003 | 0.5557 | No | ||
| 14 | KLRB1A | 4120722 | 7423 | 0.001 | 0.5243 | No | ||
| 15 | CAPN9 | 3450097 5910687 | 7429 | 0.001 | 0.5241 | No | ||
| 16 | C330007P06RIK | 2760035 | 7708 | 0.001 | 0.5092 | No | ||
| 17 | ENPP2 | 5860546 | 7832 | 0.000 | 0.5027 | No | ||
| 18 | EFNA2 | 460193 | 10991 | -0.010 | 0.3340 | No | ||
| 19 | SYTL4 | 3060066 | 12737 | -0.022 | 0.2426 | No | ||
| 20 | OSTF1 | 6770309 | 13058 | -0.026 | 0.2284 | No | ||
| 21 | CYFIP1 | 5690082 | 14237 | -0.046 | 0.1704 | No | ||
| 22 | WDR23 | 2030372 | 14424 | -0.051 | 0.1663 | No | ||
| 23 | TSPAN7 | 870133 | 14519 | -0.054 | 0.1675 | No | ||
| 24 | BCKDHB | 780372 | 16558 | -0.209 | 0.0820 | No | ||
| 25 | S100A4 | 3780113 | 16825 | -0.248 | 0.0963 | No |