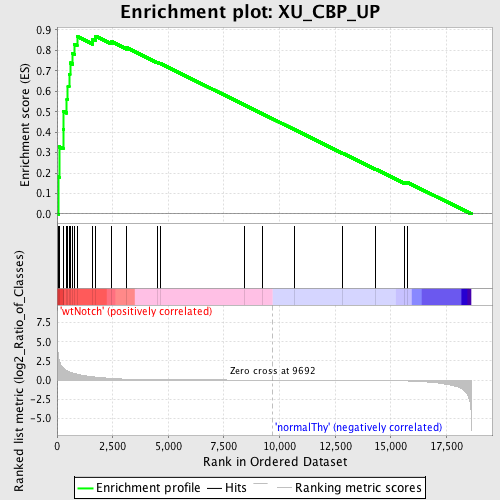
Profile of the Running ES Score & Positions of GeneSet Members on the Rank Ordered List
| Dataset | Set_03_wtNotch_versus_normalThy.phenotype_wtNotch_versus_normalThy.cls #wtNotch_versus_normalThy.phenotype_wtNotch_versus_normalThy.cls #wtNotch_versus_normalThy_repos |
| Phenotype | phenotype_wtNotch_versus_normalThy.cls#wtNotch_versus_normalThy_repos |
| Upregulated in class | wtNotch |
| GeneSet | XU_CBP_UP |
| Enrichment Score (ES) | 0.8699873 |
| Normalized Enrichment Score (NES) | 1.5694516 |
| Nominal p-value | 0.0053956835 |
| FDR q-value | 0.12344574 |
| FWER p-Value | 0.925 |
| PROBE | DESCRIPTION (from dataset) | GENE SYMBOL | GENE_TITLE | RANK IN GENE LIST | RANK METRIC SCORE | RUNNING ES | CORE ENRICHMENT | |
|---|---|---|---|---|---|---|---|---|
| 1 | GNL3 | 4050338 4810500 | 50 | 3.235 | 0.1814 | Yes | ||
| 2 | HMOX1 | 1740687 | 92 | 2.622 | 0.3284 | Yes | ||
| 3 | PPAN | 540398 | 271 | 1.632 | 0.4118 | Yes | ||
| 4 | 2600005C20RIK | 1090746 5220242 | 284 | 1.596 | 0.5020 | Yes | ||
| 5 | PRMT1 | 2850050 | 441 | 1.205 | 0.5622 | Yes | ||
| 6 | LGMN | 3610301 | 488 | 1.138 | 0.6244 | Yes | ||
| 7 | LRG1 | 5690605 | 537 | 1.065 | 0.6824 | Yes | ||
| 8 | NME4 | 3140736 5900446 | 580 | 1.028 | 0.7387 | Yes | ||
| 9 | ALG3 | 2650647 7100131 | 702 | 0.924 | 0.7848 | Yes | ||
| 10 | ADSL | 5570484 | 776 | 0.875 | 0.8307 | Yes | ||
| 11 | TSTA3 | 1230100 | 897 | 0.775 | 0.8683 | Yes | ||
| 12 | XPOT | 7050184 | 1600 | 0.428 | 0.8549 | Yes | ||
| 13 | S100A6 | 1690204 | 1726 | 0.383 | 0.8700 | Yes | ||
| 14 | RAD1 | 4200551 | 2441 | 0.208 | 0.8434 | No | ||
| 15 | MCM2 | 5050139 | 3131 | 0.118 | 0.8131 | No | ||
| 16 | NVL | 2690687 6900735 | 4492 | 0.038 | 0.7421 | No | ||
| 17 | 9830147J24RIK | 2690451 | 4651 | 0.034 | 0.7355 | No | ||
| 18 | RCN1 | 2480041 | 8405 | 0.004 | 0.5339 | No | ||
| 19 | LRRN1 | 3290154 | 9226 | 0.001 | 0.4899 | No | ||
| 20 | MELA | 2340438 3450717 | 10675 | -0.003 | 0.4122 | No | ||
| 21 | PROM1 | 3170537 | 12810 | -0.012 | 0.2981 | No | ||
| 22 | CTLA2B | 4210168 | 14323 | -0.032 | 0.2186 | No | ||
| 23 | 8430420C20RIK | 6110465 | 15599 | -0.100 | 0.1557 | No | ||
| 24 | KTN1 | 70446 3450609 4560048 | 15746 | -0.115 | 0.1544 | No |

