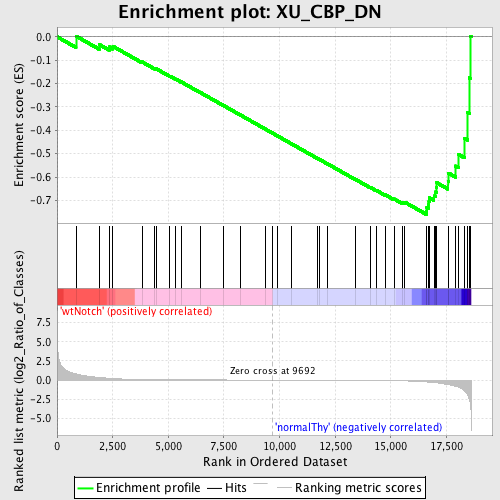
Profile of the Running ES Score & Positions of GeneSet Members on the Rank Ordered List
| Dataset | Set_03_wtNotch_versus_normalThy.phenotype_wtNotch_versus_normalThy.cls #wtNotch_versus_normalThy.phenotype_wtNotch_versus_normalThy.cls #wtNotch_versus_normalThy_repos |
| Phenotype | phenotype_wtNotch_versus_normalThy.cls#wtNotch_versus_normalThy_repos |
| Upregulated in class | normalThy |
| GeneSet | XU_CBP_DN |
| Enrichment Score (ES) | -0.7599162 |
| Normalized Enrichment Score (NES) | -1.5966567 |
| Nominal p-value | 0.006993007 |
| FDR q-value | 0.28527594 |
| FWER p-Value | 0.846 |
| PROBE | DESCRIPTION (from dataset) | GENE SYMBOL | GENE_TITLE | RANK IN GENE LIST | RANK METRIC SCORE | RUNNING ES | CORE ENRICHMENT | |
|---|---|---|---|---|---|---|---|---|
| 1 | SLC25A3 | 670112 | 850 | 0.814 | 0.0029 | No | ||
| 2 | TGFB1 | 1940162 | 1890 | 0.338 | -0.0328 | No | ||
| 3 | IGH-1A | 360113 4670341 | 2338 | 0.229 | -0.0432 | No | ||
| 4 | PSCD1 | 110113 2470592 | 2510 | 0.195 | -0.0407 | No | ||
| 5 | ETS1 | 5270278 6450717 6620465 | 3819 | 0.063 | -0.1074 | No | ||
| 6 | GSN | 3830168 | 4386 | 0.041 | -0.1354 | No | ||
| 7 | ANP32A | 510044 1580095 2680037 | 4462 | 0.039 | -0.1372 | No | ||
| 8 | ANKRD17 | 2120402 3850035 6400044 | 5071 | 0.026 | -0.1683 | No | ||
| 9 | FCER2A | 5550242 5720403 | 5321 | 0.023 | -0.1803 | No | ||
| 10 | ERCC2 | 2360750 4060390 6550138 | 5575 | 0.020 | -0.1928 | No | ||
| 11 | LAT2 | 5340440 | 6422 | 0.013 | -0.2375 | No | ||
| 12 | GABRG3 | 6650041 | 7497 | 0.008 | -0.2949 | No | ||
| 13 | MS4A4C | 5360605 | 8248 | 0.005 | -0.3350 | No | ||
| 14 | ALDH1A3 | 2100270 | 9369 | 0.001 | -0.3952 | No | ||
| 15 | CASP9 | 60577 1170368 2060576 | 9666 | 0.000 | -0.4112 | No | ||
| 16 | FRAT2 | 1450685 | 9886 | -0.001 | -0.4229 | No | ||
| 17 | TCTE2 | 2450446 | 10529 | -0.003 | -0.4573 | No | ||
| 18 | NUCB2 | 5690181 | 11693 | -0.007 | -0.5196 | No | ||
| 19 | DIAP1 | 2850451 4760341 | 11782 | -0.007 | -0.5239 | No | ||
| 20 | TPR | 1990066 6550390 | 12150 | -0.009 | -0.5431 | No | ||
| 21 | ARHGEF2 | 3360577 | 13426 | -0.017 | -0.6108 | No | ||
| 22 | EPHA4 | 460750 | 14085 | -0.027 | -0.6446 | No | ||
| 23 | CCR6 | 5720368 6020176 | 14337 | -0.032 | -0.6562 | No | ||
| 24 | TBC1D10A | 2100615 | 14741 | -0.043 | -0.6753 | No | ||
| 25 | VAV2 | 3610725 5890717 | 15151 | -0.064 | -0.6936 | No | ||
| 26 | LTA | 1740088 | 15537 | -0.093 | -0.7087 | No | ||
| 27 | IGH-VJ558 | 60025 1690184 | 15635 | -0.103 | -0.7077 | No | ||
| 28 | CIITA | 2650242 | 16605 | -0.249 | -0.7450 | Yes | ||
| 29 | ATP1A1 | 5670451 | 16619 | -0.252 | -0.7307 | Yes | ||
| 30 | 9430098E02RIK | 2470088 | 16694 | -0.264 | -0.7189 | Yes | ||
| 31 | PER2 | 3120204 3390593 | 16712 | -0.267 | -0.7038 | Yes | ||
| 32 | ARF6 | 3520026 | 16734 | -0.270 | -0.6888 | Yes | ||
| 33 | SDF2 | 2690601 | 16940 | -0.321 | -0.6806 | Yes | ||
| 34 | 5830457O10RIK | 60735 2350494 3830411 3940273 | 17003 | -0.340 | -0.6636 | Yes | ||
| 35 | RELB | 1400048 | 17053 | -0.356 | -0.6449 | Yes | ||
| 36 | NR1H2 | 4070056 | 17065 | -0.359 | -0.6241 | Yes | ||
| 37 | RAB14 | 6860139 | 17570 | -0.576 | -0.6168 | Yes | ||
| 38 | ADAR | 2470239 | 17595 | -0.586 | -0.5830 | Yes | ||
| 39 | ZFP574 | 1660253 | 17915 | -0.797 | -0.5525 | Yes | ||
| 40 | CD97 | 1090673 1690575 | 18046 | -0.935 | -0.5036 | Yes | ||
| 41 | HSD11B1 | 450066 5550408 | 18314 | -1.402 | -0.4341 | Yes | ||
| 42 | COTL1 | 3840050 6350215 | 18457 | -1.954 | -0.3249 | Yes | ||
| 43 | IGH-6 | 5720193 6550075 | 18533 | -2.564 | -0.1756 | Yes | ||
| 44 | CCR7 | 2060687 | 18568 | -3.010 | 0.0026 | Yes |

