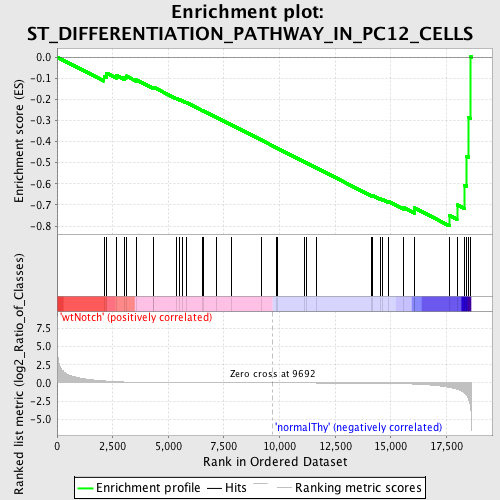
Profile of the Running ES Score & Positions of GeneSet Members on the Rank Ordered List
| Dataset | Set_03_wtNotch_versus_normalThy.phenotype_wtNotch_versus_normalThy.cls #wtNotch_versus_normalThy.phenotype_wtNotch_versus_normalThy.cls #wtNotch_versus_normalThy_repos |
| Phenotype | phenotype_wtNotch_versus_normalThy.cls#wtNotch_versus_normalThy_repos |
| Upregulated in class | normalThy |
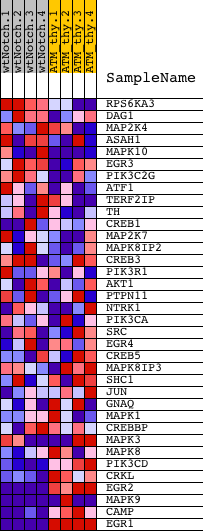
| GeneSet | ST_DIFFERENTIATION_PATHWAY_IN_PC12_CELLS |
| Enrichment Score (ES) | -0.7994978 |
| Normalized Enrichment Score (NES) | -1.6215762 |
| Nominal p-value | 0.0022522523 |
| FDR q-value | 0.23788127 |
| FWER p-Value | 0.695 |
| PROBE | DESCRIPTION (from dataset) | GENE SYMBOL | GENE_TITLE | RANK IN GENE LIST | RANK METRIC SCORE | RUNNING ES | CORE ENRICHMENT | |
|---|---|---|---|---|---|---|---|---|
| 1 | RPS6KA3 | 1980707 | 2107 | 0.281 | -0.0908 | No | ||
| 2 | DAG1 | 460053 610341 | 2215 | 0.258 | -0.0758 | No | ||
| 3 | MAP2K4 | 5130133 | 2655 | 0.172 | -0.0857 | No | ||
| 4 | ASAH1 | 510152 1340484 1740707 | 3021 | 0.128 | -0.0950 | No | ||
| 5 | MAPK10 | 6110193 | 3099 | 0.121 | -0.0894 | No | ||
| 6 | EGR3 | 6940128 | 3564 | 0.080 | -0.1080 | No | ||
| 7 | PIK3C2G | 3060019 | 4310 | 0.043 | -0.1446 | No | ||
| 8 | ATF1 | 4570142 5550095 | 4339 | 0.042 | -0.1428 | No | ||
| 9 | TERF2IP | 580010 870364 2190358 | 5357 | 0.023 | -0.1957 | No | ||
| 10 | TH | 2100056 | 5511 | 0.021 | -0.2022 | No | ||
| 11 | CREB1 | 1500717 2230358 3610600 6550601 | 5622 | 0.020 | -0.2066 | No | ||
| 12 | MAP2K7 | 2260086 | 5805 | 0.018 | -0.2149 | No | ||
| 13 | MAPK8IP2 | 630373 | 6556 | 0.012 | -0.2543 | No | ||
| 14 | CREB3 | 5220408 | 6557 | 0.012 | -0.2533 | No | ||
| 15 | PIK3R1 | 4730671 | 7181 | 0.009 | -0.2862 | No | ||
| 16 | AKT1 | 5290746 | 7820 | 0.006 | -0.3200 | No | ||
| 17 | PTPN11 | 2230100 2470180 6100528 | 9170 | 0.002 | -0.3925 | No | ||
| 18 | NTRK1 | 6400538 | 9877 | -0.001 | -0.4304 | No | ||
| 19 | PIK3CA | 6220129 | 9883 | -0.001 | -0.4306 | No | ||
| 20 | SRC | 580132 | 11138 | -0.004 | -0.4978 | No | ||
| 21 | EGR4 | 3120750 | 11194 | -0.005 | -0.5003 | No | ||
| 22 | CREB5 | 2320368 | 11672 | -0.006 | -0.5255 | No | ||
| 23 | MAPK8IP3 | 1660112 2060427 | 14145 | -0.028 | -0.6563 | No | ||
| 24 | SHC1 | 2900731 3170504 6520537 | 14167 | -0.028 | -0.6552 | No | ||
| 25 | JUN | 840170 | 14517 | -0.036 | -0.6711 | No | ||
| 26 | GNAQ | 430670 4210131 5900736 | 14645 | -0.040 | -0.6747 | No | ||
| 27 | MAPK1 | 3190193 6200253 | 14896 | -0.050 | -0.6842 | No | ||
| 28 | CREBBP | 5690035 7040050 | 15556 | -0.095 | -0.7120 | No | ||
| 29 | MAPK3 | 580161 4780035 | 16052 | -0.154 | -0.7263 | No | ||
| 30 | MAPK8 | 2640195 | 16060 | -0.156 | -0.7141 | No | ||
| 31 | PIK3CD | 3060546 | 17647 | -0.614 | -0.7501 | Yes | ||
| 32 | CRKL | 4050427 | 17976 | -0.847 | -0.6997 | Yes | ||
| 33 | EGR2 | 3800403 | 18311 | -1.393 | -0.6057 | Yes | ||
| 34 | MAPK9 | 2060273 3780209 4070397 | 18415 | -1.759 | -0.4699 | Yes | ||
| 35 | CAMP | 6290735 | 18507 | -2.343 | -0.2866 | Yes | ||
| 36 | EGR1 | 4610347 | 18597 | -3.640 | 0.0010 | Yes |