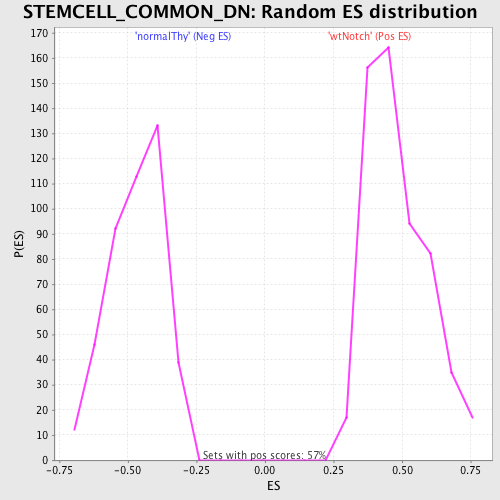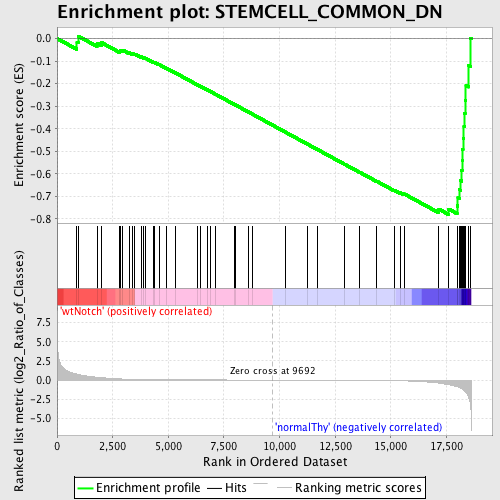
Profile of the Running ES Score & Positions of GeneSet Members on the Rank Ordered List
| Dataset | Set_03_wtNotch_versus_normalThy.phenotype_wtNotch_versus_normalThy.cls #wtNotch_versus_normalThy.phenotype_wtNotch_versus_normalThy.cls #wtNotch_versus_normalThy_repos |
| Phenotype | phenotype_wtNotch_versus_normalThy.cls#wtNotch_versus_normalThy_repos |
| Upregulated in class | normalThy |
| GeneSet | STEMCELL_COMMON_DN |
| Enrichment Score (ES) | -0.78018486 |
| Normalized Enrichment Score (NES) | -1.6602823 |
| Nominal p-value | 0.0 |
| FDR q-value | 0.16121341 |
| FWER p-Value | 0.381 |
| PROBE | DESCRIPTION (from dataset) | GENE SYMBOL | GENE_TITLE | RANK IN GENE LIST | RANK METRIC SCORE | RUNNING ES | CORE ENRICHMENT | |
|---|---|---|---|---|---|---|---|---|
| 1 | CD68 | 6350450 | 892 | 0.781 | -0.0160 | No | ||
| 2 | D15WSU75E | 6900451 | 947 | 0.720 | 0.0107 | No | ||
| 3 | PTPRC | 130402 5290148 | 1795 | 0.364 | -0.0200 | No | ||
| 4 | GRINA | 4570519 | 1998 | 0.310 | -0.0182 | No | ||
| 5 | SLC11A1 | 940286 2810435 6370647 | 2815 | 0.150 | -0.0560 | No | ||
| 6 | STMN1 | 1990717 | 2854 | 0.145 | -0.0520 | No | ||
| 7 | CSF1R | 2340110 6420408 | 2951 | 0.134 | -0.0517 | No | ||
| 8 | SIRPA | 130465 5700332 | 3248 | 0.106 | -0.0633 | No | ||
| 9 | BMP1 | 380594 2940576 3710593 | 3396 | 0.092 | -0.0674 | No | ||
| 10 | ZAP70 | 1410494 2260504 | 3498 | 0.085 | -0.0693 | No | ||
| 11 | PPP3CA | 4760332 6760092 | 3770 | 0.066 | -0.0812 | No | ||
| 12 | EFHD1 | 4070358 | 3882 | 0.060 | -0.0847 | No | ||
| 13 | ABR | 610079 1170609 3610195 5670050 | 3979 | 0.056 | -0.0876 | No | ||
| 14 | LY86 | 2230093 | 4346 | 0.042 | -0.1056 | No | ||
| 15 | GSN | 3830168 | 4386 | 0.041 | -0.1061 | No | ||
| 16 | SEPT5 | 460725 | 4582 | 0.036 | -0.1151 | No | ||
| 17 | RELN | 6510037 | 4934 | 0.029 | -0.1328 | No | ||
| 18 | KCNAB2 | 4850315 | 5312 | 0.023 | -0.1522 | No | ||
| 19 | EMR1 | 70136 1500592 | 6319 | 0.014 | -0.2058 | No | ||
| 20 | LAT2 | 5340440 | 6422 | 0.013 | -0.2108 | No | ||
| 21 | ABLIM1 | 580170 3710338 6520504 | 6741 | 0.011 | -0.2274 | No | ||
| 22 | CTSS | 1740056 | 6894 | 0.010 | -0.2352 | No | ||
| 23 | MAL | 4280487 4590239 | 7120 | 0.009 | -0.2470 | No | ||
| 24 | NIN | 3450576 5080048 | 7967 | 0.006 | -0.2923 | No | ||
| 25 | CBX4 | 70332 | 8001 | 0.006 | -0.2938 | No | ||
| 26 | CLEC4A | 2470292 | 8623 | 0.003 | -0.3271 | No | ||
| 27 | HDC | 4150463 | 8791 | 0.003 | -0.3360 | No | ||
| 28 | ACVRL1 | 3290600 | 10273 | -0.002 | -0.4157 | No | ||
| 29 | GYPA | 540402 | 11274 | -0.005 | -0.4694 | No | ||
| 30 | CEBPD | 3360176 | 11685 | -0.006 | -0.4912 | No | ||
| 31 | RBMX | 7100162 2900541 | 12914 | -0.013 | -0.5568 | No | ||
| 32 | ARG2 | 6940463 | 13586 | -0.019 | -0.5922 | No | ||
| 33 | NCAM1 | 3140026 | 14373 | -0.033 | -0.6332 | No | ||
| 34 | TYROBP | 2230020 | 15168 | -0.065 | -0.6733 | No | ||
| 35 | PAPSS2 | 870113 | 15439 | -0.085 | -0.6843 | No | ||
| 36 | BIN1 | 5420348 5670500 | 15607 | -0.101 | -0.6892 | No | ||
| 37 | ITGB2 | 6380348 | 17157 | -0.394 | -0.7565 | Yes | ||
| 38 | ST3GAL6 | 5910184 | 17598 | -0.587 | -0.7561 | Yes | ||
| 39 | EVL | 1740113 | 17980 | -0.850 | -0.7417 | Yes | ||
| 40 | CD53 | 5550162 | 18017 | -0.897 | -0.7068 | Yes | ||
| 41 | CST3 | 7050452 | 18078 | -0.976 | -0.6700 | Yes | ||
| 42 | PACSIN1 | 3870632 6370021 6900707 | 18140 | -1.047 | -0.6303 | Yes | ||
| 43 | ADSSL1 | 4850132 7000288 | 18187 | -1.131 | -0.5863 | Yes | ||
| 44 | PPP2R5A | 1990497 | 18206 | -1.166 | -0.5394 | Yes | ||
| 45 | CD47 | 1850603 | 18214 | -1.182 | -0.4913 | Yes | ||
| 46 | ZDHHC14 | 3780458 | 18246 | -1.242 | -0.4420 | Yes | ||
| 47 | PGLYRP1 | 6760242 | 18287 | -1.339 | -0.3891 | Yes | ||
| 48 | HSD11B1 | 450066 5550408 | 18314 | -1.402 | -0.3330 | Yes | ||
| 49 | RGS10 | 2340292 | 18341 | -1.498 | -0.2729 | Yes | ||
| 50 | RGS14 | 380086 | 18378 | -1.618 | -0.2084 | Yes | ||
| 51 | CORO1A | 3140609 3190020 3190037 | 18501 | -2.308 | -0.1202 | Yes | ||
| 52 | CYFIP2 | 520577 6040300 | 18576 | -3.076 | 0.0022 | Yes |