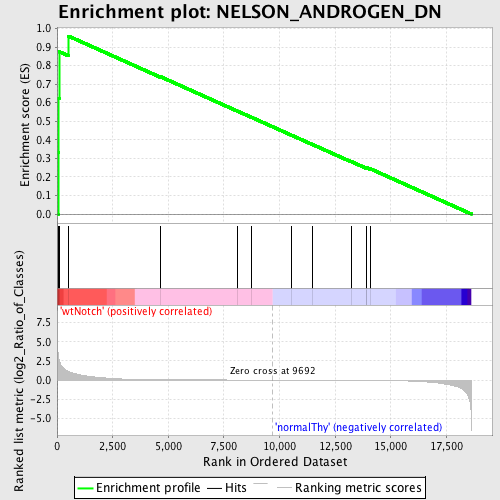
Profile of the Running ES Score & Positions of GeneSet Members on the Rank Ordered List
| Dataset | Set_03_wtNotch_versus_normalThy.phenotype_wtNotch_versus_normalThy.cls #wtNotch_versus_normalThy.phenotype_wtNotch_versus_normalThy.cls #wtNotch_versus_normalThy_repos |
| Phenotype | phenotype_wtNotch_versus_normalThy.cls#wtNotch_versus_normalThy_repos |
| Upregulated in class | wtNotch |
| GeneSet | NELSON_ANDROGEN_DN |
| Enrichment Score (ES) | 0.95897293 |
| Normalized Enrichment Score (NES) | 1.5857352 |
| Nominal p-value | 0.0 |
| FDR q-value | 0.10251944 |
| FWER p-Value | 0.832 |
| PROBE | DESCRIPTION (from dataset) | GENE SYMBOL | GENE_TITLE | RANK IN GENE LIST | RANK METRIC SCORE | RUNNING ES | CORE ENRICHMENT | |
|---|---|---|---|---|---|---|---|---|
| 1 | HES6 | 540411 6550504 | 45 | 3.458 | 0.3326 | Yes | ||
| 2 | SDC4 | 6370411 | 61 | 3.005 | 0.6230 | Yes | ||
| 3 | DDC | 670408 | 93 | 2.618 | 0.8750 | Yes | ||
| 4 | PIK3R3 | 1770333 | 515 | 1.100 | 0.9590 | Yes | ||
| 5 | FN1 | 1170601 2970647 6220288 6940037 | 4652 | 0.034 | 0.7400 | No | ||
| 6 | MYC | 380541 4670170 | 8113 | 0.005 | 0.5545 | No | ||
| 7 | MMP16 | 2680139 | 8737 | 0.003 | 0.5213 | No | ||
| 8 | BCHE | 2190685 | 10551 | -0.003 | 0.4241 | No | ||
| 9 | PEG3 | 3710020 | 11485 | -0.006 | 0.3745 | No | ||
| 10 | CDK8 | 1050113 1190601 1780358 6110102 | 13212 | -0.015 | 0.2832 | No | ||
| 11 | CTBP1 | 3780315 | 13908 | -0.024 | 0.2481 | No | ||
| 12 | ST7 | 60600 610373 | 13910 | -0.024 | 0.2504 | No | ||
| 13 | SCNN1A | 4730019 | 14069 | -0.026 | 0.2444 | No |

