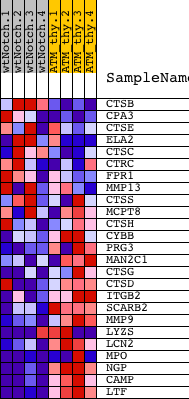
Profile of the Running ES Score & Positions of GeneSet Members on the Rank Ordered List
| Dataset | Set_03_wtNotch_versus_normalThy.phenotype_wtNotch_versus_normalThy.cls #wtNotch_versus_normalThy.phenotype_wtNotch_versus_normalThy.cls #wtNotch_versus_normalThy_repos |
| Phenotype | phenotype_wtNotch_versus_normalThy.cls#wtNotch_versus_normalThy_repos |
| Upregulated in class | normalThy |
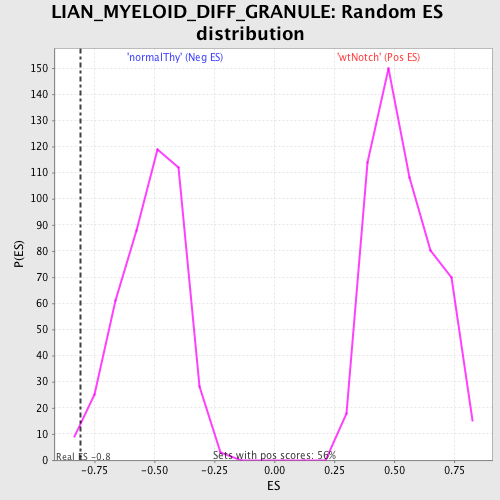
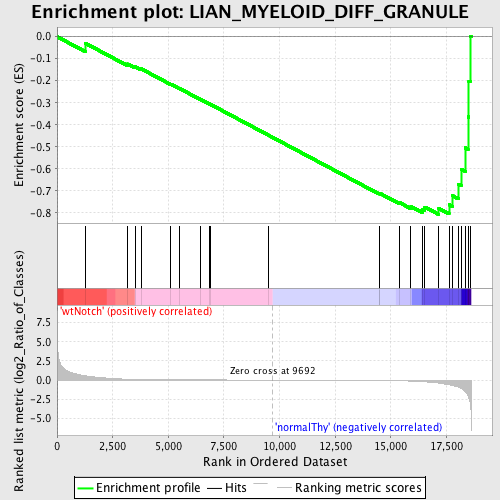
| GeneSet | LIAN_MYELOID_DIFF_GRANULE |
| Enrichment Score (ES) | -0.80792487 |
| Normalized Enrichment Score (NES) | -1.56666 |
| Nominal p-value | 0.006741573 |
| FDR q-value | 0.28477916 |
| FWER p-Value | 0.974 |
| PROBE | DESCRIPTION (from dataset) | GENE SYMBOL | GENE_TITLE | RANK IN GENE LIST | RANK METRIC SCORE | RUNNING ES | CORE ENRICHMENT | |
|---|---|---|---|---|---|---|---|---|
| 1 | CTSB | 1400524 2360064 | 1277 | 0.547 | -0.0302 | No | ||
| 2 | CPA3 | 610242 6380102 | 3170 | 0.114 | -0.1239 | No | ||
| 3 | CTSE | 2030292 | 3501 | 0.085 | -0.1357 | No | ||
| 4 | ELA2 | 1570452 5270129 | 3772 | 0.066 | -0.1456 | No | ||
| 5 | CTSC | 2230739 4670408 | 5105 | 0.026 | -0.2154 | No | ||
| 6 | CTRC | 3060152 | 5496 | 0.021 | -0.2349 | No | ||
| 7 | FPR1 | 3800577 | 6457 | 0.013 | -0.2856 | No | ||
| 8 | MMP13 | 510471 3940097 | 6828 | 0.011 | -0.3048 | No | ||
| 9 | CTSS | 1740056 | 6894 | 0.010 | -0.3076 | No | ||
| 10 | MCPT8 | 2480707 | 9509 | 0.001 | -0.4481 | No | ||
| 11 | CTSH | 60524 | 14472 | -0.035 | -0.7126 | No | ||
| 12 | CYBB | 3870020 | 14507 | -0.035 | -0.7119 | No | ||
| 13 | PRG3 | 6220020 | 15368 | -0.078 | -0.7527 | No | ||
| 14 | MAN2C1 | 6770064 | 15902 | -0.134 | -0.7719 | No | ||
| 15 | CTSG | 1190711 | 16411 | -0.213 | -0.7843 | Yes | ||
| 16 | CTSD | 1070195 | 16525 | -0.233 | -0.7740 | Yes | ||
| 17 | ITGB2 | 6380348 | 17157 | -0.394 | -0.7802 | Yes | ||
| 18 | SCARB2 | 6220279 | 17618 | -0.599 | -0.7628 | Yes | ||
| 19 | MMP9 | 580338 | 17760 | -0.688 | -0.7219 | Yes | ||
| 20 | LYZS | 50068 6770717 | 18044 | -0.932 | -0.6716 | Yes | ||
| 21 | LCN2 | 2510112 | 18163 | -1.085 | -0.6016 | Yes | ||
| 22 | MPO | 2360176 2760440 5690176 | 18349 | -1.516 | -0.5048 | Yes | ||
| 23 | NGP | 2640133 | 18474 | -2.090 | -0.3645 | Yes | ||
| 24 | CAMP | 6290735 | 18507 | -2.343 | -0.2013 | Yes | ||
| 25 | LTF | 6770364 | 18566 | -2.943 | 0.0027 | Yes |