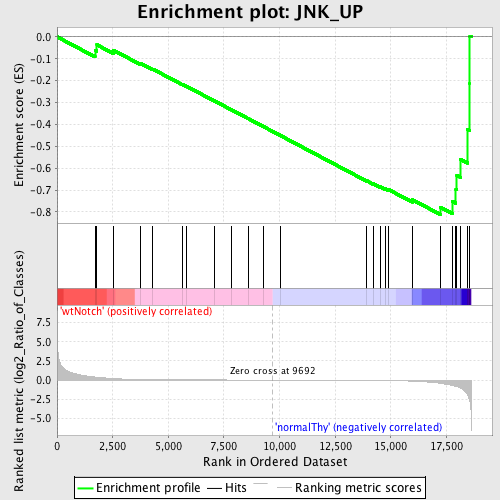
Profile of the Running ES Score & Positions of GeneSet Members on the Rank Ordered List
| Dataset | Set_03_wtNotch_versus_normalThy.phenotype_wtNotch_versus_normalThy.cls #wtNotch_versus_normalThy.phenotype_wtNotch_versus_normalThy.cls #wtNotch_versus_normalThy_repos |
| Phenotype | phenotype_wtNotch_versus_normalThy.cls#wtNotch_versus_normalThy_repos |
| Upregulated in class | normalThy |
| GeneSet | JNK_UP |
| Enrichment Score (ES) | -0.81173617 |
| Normalized Enrichment Score (NES) | -1.5776758 |
| Nominal p-value | 0.0064794817 |
| FDR q-value | 0.31097546 |
| FWER p-Value | 0.94 |
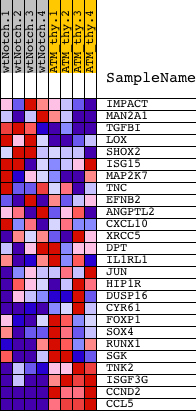
| PROBE | DESCRIPTION (from dataset) | GENE SYMBOL | GENE_TITLE | RANK IN GENE LIST | RANK METRIC SCORE | RUNNING ES | CORE ENRICHMENT | |
|---|---|---|---|---|---|---|---|---|
| 1 | IMPACT | 6350551 | 1707 | 0.387 | -0.0612 | No | ||
| 2 | MAN2A1 | 6650176 | 1788 | 0.367 | -0.0364 | No | ||
| 3 | TGFBI | 2060446 6900112 | 2530 | 0.191 | -0.0612 | No | ||
| 4 | LOX | 5340372 | 3729 | 0.068 | -0.1202 | No | ||
| 5 | SHOX2 | 3190438 6450059 | 4308 | 0.043 | -0.1479 | No | ||
| 6 | ISG15 | 3170093 | 5621 | 0.020 | -0.2169 | No | ||
| 7 | MAP2K7 | 2260086 | 5805 | 0.018 | -0.2253 | No | ||
| 8 | TNC | 670053 1780039 1980020 3060411 4780091 6860433 | 7095 | 0.009 | -0.2939 | No | ||
| 9 | EFNB2 | 5340136 | 7824 | 0.006 | -0.3326 | No | ||
| 10 | ANGPTL2 | 6980152 6760162 | 8619 | 0.003 | -0.3750 | No | ||
| 11 | CXCL10 | 2450408 | 9268 | 0.001 | -0.4098 | No | ||
| 12 | XRCC5 | 7100286 | 10048 | -0.001 | -0.4516 | No | ||
| 13 | DPT | 5670731 | 13921 | -0.024 | -0.6580 | No | ||
| 14 | IL1RL1 | 3990224 6020347 | 14201 | -0.029 | -0.6707 | No | ||
| 15 | JUN | 840170 | 14517 | -0.036 | -0.6848 | No | ||
| 16 | HIP1R | 3120368 | 14739 | -0.043 | -0.6933 | No | ||
| 17 | DUSP16 | 2370082 2480450 | 14875 | -0.049 | -0.6967 | No | ||
| 18 | CYR61 | 1240408 5290026 4120452 6550008 | 15960 | -0.142 | -0.7438 | No | ||
| 19 | FOXP1 | 6510433 | 17224 | -0.422 | -0.7783 | Yes | ||
| 20 | SOX4 | 2260091 | 17765 | -0.693 | -0.7525 | Yes | ||
| 21 | RUNX1 | 3840711 | 17925 | -0.807 | -0.6973 | Yes | ||
| 22 | SGK | 1400131 2480056 | 17968 | -0.841 | -0.6330 | Yes | ||
| 23 | TNK2 | 1570390 | 18128 | -1.038 | -0.5594 | Yes | ||
| 24 | ISGF3G | 3190131 7100142 | 18453 | -1.937 | -0.4236 | Yes | ||
| 25 | CCND2 | 5340167 | 18548 | -2.713 | -0.2140 | Yes | ||
| 26 | CCL5 | 3710397 | 18554 | -2.751 | 0.0033 | Yes |