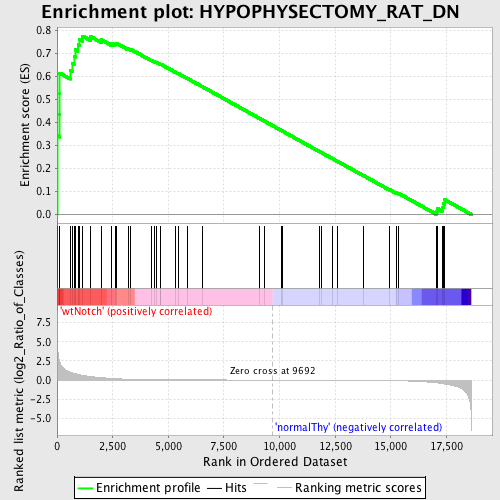
Profile of the Running ES Score & Positions of GeneSet Members on the Rank Ordered List
| Dataset | Set_03_wtNotch_versus_normalThy.phenotype_wtNotch_versus_normalThy.cls #wtNotch_versus_normalThy.phenotype_wtNotch_versus_normalThy.cls #wtNotch_versus_normalThy_repos |
| Phenotype | phenotype_wtNotch_versus_normalThy.cls#wtNotch_versus_normalThy_repos |
| Upregulated in class | wtNotch |
| GeneSet | HYPOPHYSECTOMY_RAT_DN |
| Enrichment Score (ES) | 0.77627295 |
| Normalized Enrichment Score (NES) | 1.5706185 |
| Nominal p-value | 0.0035971224 |
| FDR q-value | 0.12662363 |
| FWER p-Value | 0.918 |
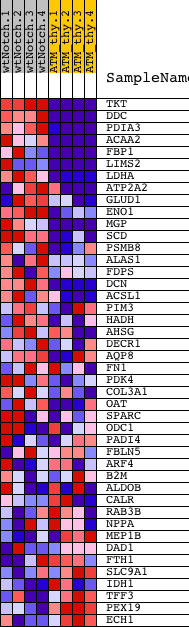
| PROBE | DESCRIPTION (from dataset) | GENE SYMBOL | GENE_TITLE | RANK IN GENE LIST | RANK METRIC SCORE | RUNNING ES | CORE ENRICHMENT | |
|---|---|---|---|---|---|---|---|---|
| 1 | TKT | 6590064 6860039 | 1 | 8.990 | 0.3420 | Yes | ||
| 2 | DDC | 670408 | 93 | 2.618 | 0.4367 | Yes | ||
| 3 | PDIA3 | 2120270 | 113 | 2.394 | 0.5268 | Yes | ||
| 4 | ACAA2 | 1570347 2360324 6130139 | 118 | 2.328 | 0.6151 | Yes | ||
| 5 | FBP1 | 1470762 | 594 | 1.016 | 0.6282 | Yes | ||
| 6 | LIMS2 | 5130204 6130129 | 703 | 0.923 | 0.6575 | Yes | ||
| 7 | LDHA | 2190594 | 764 | 0.880 | 0.6878 | Yes | ||
| 8 | ATP2A2 | 1090075 3990279 | 812 | 0.849 | 0.7176 | Yes | ||
| 9 | GLUD1 | 4210372 | 938 | 0.730 | 0.7386 | Yes | ||
| 10 | ENO1 | 5340128 | 992 | 0.689 | 0.7620 | Yes | ||
| 11 | MGP | 6900736 | 1151 | 0.600 | 0.7763 | Yes | ||
| 12 | SCD | 2680441 | 1517 | 0.450 | 0.7737 | No | ||
| 13 | PSMB8 | 2850707 | 1984 | 0.313 | 0.7606 | No | ||
| 14 | ALAS1 | 6400440 | 2434 | 0.211 | 0.7444 | No | ||
| 15 | FDPS | 60022 | 2603 | 0.179 | 0.7422 | No | ||
| 16 | DCN | 510332 5340026 5900711 6550092 | 2650 | 0.173 | 0.7463 | No | ||
| 17 | ACSL1 | 2900520 | 3195 | 0.112 | 0.7213 | No | ||
| 18 | PIM3 | 3360138 | 3305 | 0.101 | 0.7192 | No | ||
| 19 | HADH | 1690341 3830465 | 4239 | 0.045 | 0.6707 | No | ||
| 20 | AHSG | 6450014 | 4378 | 0.041 | 0.6648 | No | ||
| 21 | DECR1 | 6590390 | 4461 | 0.039 | 0.6619 | No | ||
| 22 | AQP8 | 6770402 | 4626 | 0.035 | 0.6544 | No | ||
| 23 | FN1 | 1170601 2970647 6220288 6940037 | 4652 | 0.034 | 0.6543 | No | ||
| 24 | PDK4 | 6400300 | 5303 | 0.023 | 0.6202 | No | ||
| 25 | COL3A1 | 6420273 6620044 | 5436 | 0.022 | 0.6139 | No | ||
| 26 | OAT | 540632 | 5882 | 0.017 | 0.5906 | No | ||
| 27 | SPARC | 1690086 | 6541 | 0.012 | 0.5557 | No | ||
| 28 | ODC1 | 5670168 | 9074 | 0.002 | 0.4194 | No | ||
| 29 | PADI4 | 1740075 4810441 | 9343 | 0.001 | 0.4050 | No | ||
| 30 | FBLN5 | 6550010 | 10106 | -0.001 | 0.3640 | No | ||
| 31 | ARF4 | 3190661 | 10109 | -0.001 | 0.3640 | No | ||
| 32 | B2M | 5080332 5130059 | 11781 | -0.007 | 0.2743 | No | ||
| 33 | ALDOB | 4730324 | 11882 | -0.007 | 0.2692 | No | ||
| 34 | CALR | 510446 | 12381 | -0.010 | 0.2427 | No | ||
| 35 | RAB3B | 110068 | 12617 | -0.011 | 0.2305 | No | ||
| 36 | NPPA | 6550328 | 13790 | -0.022 | 0.1682 | No | ||
| 37 | MEP1B | 1240341 5270168 | 14944 | -0.052 | 0.1081 | No | ||
| 38 | DAD1 | 430239 | 15234 | -0.069 | 0.0952 | No | ||
| 39 | FTH1 | 3830154 | 15352 | -0.077 | 0.0918 | No | ||
| 40 | SLC9A1 | 2650093 | 17035 | -0.351 | 0.0146 | No | ||
| 41 | IDH1 | 1990021 | 17109 | -0.377 | 0.0250 | No | ||
| 42 | TFF3 | 1580129 | 17339 | -0.476 | 0.0307 | No | ||
| 43 | PEX19 | 3140037 | 17358 | -0.484 | 0.0482 | No | ||
| 44 | ECH1 | 4120746 | 17423 | -0.512 | 0.0642 | No |