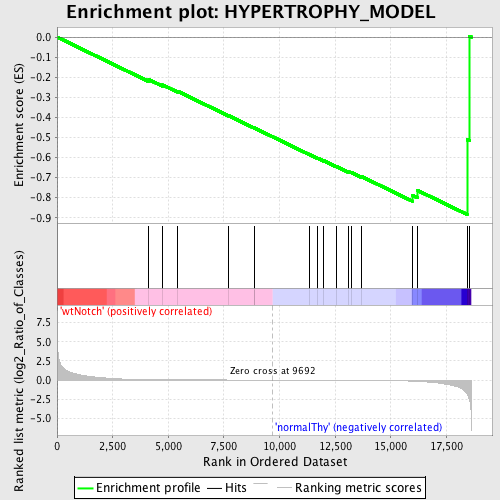
Profile of the Running ES Score & Positions of GeneSet Members on the Rank Ordered List
| Dataset | Set_03_wtNotch_versus_normalThy.phenotype_wtNotch_versus_normalThy.cls #wtNotch_versus_normalThy.phenotype_wtNotch_versus_normalThy.cls #wtNotch_versus_normalThy_repos |
| Phenotype | phenotype_wtNotch_versus_normalThy.cls#wtNotch_versus_normalThy_repos |
| Upregulated in class | normalThy |
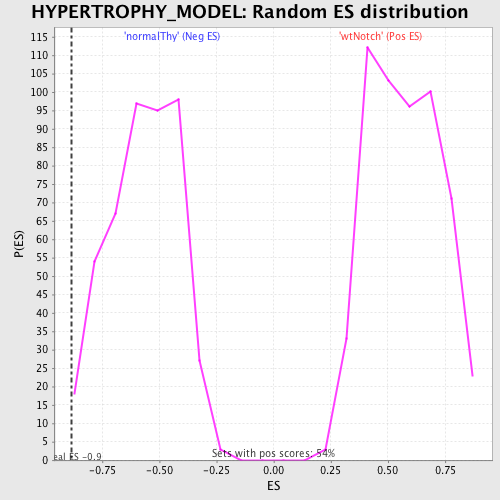
| GeneSet | HYPERTROPHY_MODEL |
| Enrichment Score (ES) | -0.8837762 |
| Normalized Enrichment Score (NES) | -1.5535136 |
| Nominal p-value | 0.015250545 |
| FDR q-value | 0.28933337 |
| FWER p-Value | 0.989 |
| PROBE | DESCRIPTION (from dataset) | GENE SYMBOL | GENE_TITLE | RANK IN GENE LIST | RANK METRIC SCORE | RUNNING ES | CORE ENRICHMENT | |
|---|---|---|---|---|---|---|---|---|
| 1 | DUSP14 | 1230358 | 4123 | 0.049 | -0.2116 | No | ||
| 2 | IL1R1 | 3850377 6180128 | 4746 | 0.032 | -0.2384 | No | ||
| 3 | HBEGF | 2030156 | 5407 | 0.022 | -0.2693 | No | ||
| 4 | ATF3 | 1940546 | 7719 | 0.007 | -0.3922 | No | ||
| 5 | ADAM10 | 3780156 | 8850 | 0.003 | -0.4524 | No | ||
| 6 | ANKRD1 | 4850685 | 8858 | 0.003 | -0.4522 | No | ||
| 7 | NR4A3 | 2900021 5860095 5910039 | 11354 | -0.005 | -0.5853 | No | ||
| 8 | GDF8 | 3850504 | 11725 | -0.007 | -0.6038 | No | ||
| 9 | IL18 | 6180039 | 11993 | -0.008 | -0.6165 | No | ||
| 10 | IL1A | 3610056 | 12553 | -0.011 | -0.6444 | No | ||
| 11 | IFNG | 5670592 | 13089 | -0.014 | -0.6702 | No | ||
| 12 | MYOG | 3190672 | 13217 | -0.015 | -0.6738 | No | ||
| 13 | IFRD1 | 4590215 | 13681 | -0.020 | -0.6945 | No | ||
| 14 | CYR61 | 1240408 5290026 4120452 6550008 | 15960 | -0.142 | -0.7876 | Yes | ||
| 15 | EIF4E | 1580403 70133 6380215 | 16200 | -0.177 | -0.7639 | Yes | ||
| 16 | WDR1 | 1090129 3990121 | 18431 | -1.805 | -0.5110 | Yes | ||
| 17 | EIF4EBP1 | 60132 5720148 | 18525 | -2.523 | 0.0049 | Yes |