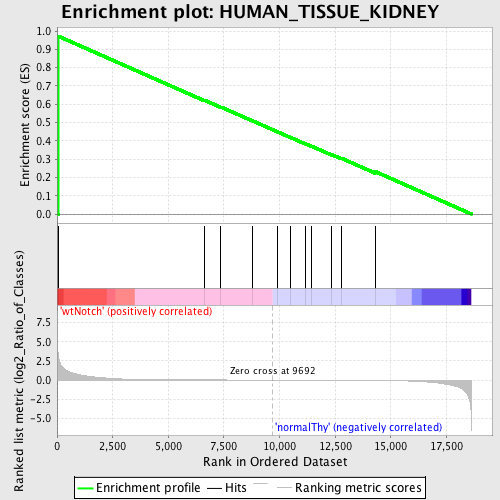
Profile of the Running ES Score & Positions of GeneSet Members on the Rank Ordered List
| Dataset | Set_03_wtNotch_versus_normalThy.phenotype_wtNotch_versus_normalThy.cls #wtNotch_versus_normalThy.phenotype_wtNotch_versus_normalThy.cls #wtNotch_versus_normalThy_repos |
| Phenotype | phenotype_wtNotch_versus_normalThy.cls#wtNotch_versus_normalThy_repos |
| Upregulated in class | wtNotch |
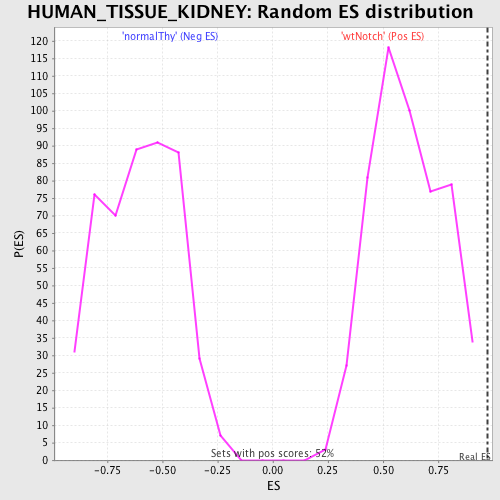
| GeneSet | HUMAN_TISSUE_KIDNEY |
| Enrichment Score (ES) | 0.97215015 |
| Normalized Enrichment Score (NES) | 1.5895394 |
| Nominal p-value | 0.0 |
| FDR q-value | 0.09996545 |
| FWER p-Value | 0.806 |
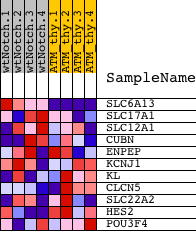
| PROBE | DESCRIPTION (from dataset) | GENE SYMBOL | GENE_TITLE | RANK IN GENE LIST | RANK METRIC SCORE | RUNNING ES | CORE ENRICHMENT | |
|---|---|---|---|---|---|---|---|---|
| 1 | SLC6A13 | 5270152 | 47 | 3.400 | 0.9722 | Yes | ||
| 2 | SLC17A1 | 5420070 | 6623 | 0.012 | 0.6222 | No | ||
| 3 | SLC12A1 | 3450017 6620133 6770148 | 7365 | 0.008 | 0.5846 | No | ||
| 4 | CUBN | 630338 | 8779 | 0.003 | 0.5095 | No | ||
| 5 | ENPEP | 130373 | 9918 | -0.001 | 0.4486 | No | ||
| 6 | KCNJ1 | 610707 870181 | 10482 | -0.002 | 0.4190 | No | ||
| 7 | KL | 3120471 | 11152 | -0.005 | 0.3843 | No | ||
| 8 | CLCN5 | 4200390 | 11441 | -0.006 | 0.3704 | No | ||
| 9 | SLC22A2 | 5670520 | 12336 | -0.009 | 0.3251 | No | ||
| 10 | HES2 | 4760347 | 12779 | -0.012 | 0.3048 | No | ||
| 11 | POU3F4 | 870274 | 14290 | -0.031 | 0.2325 | No |