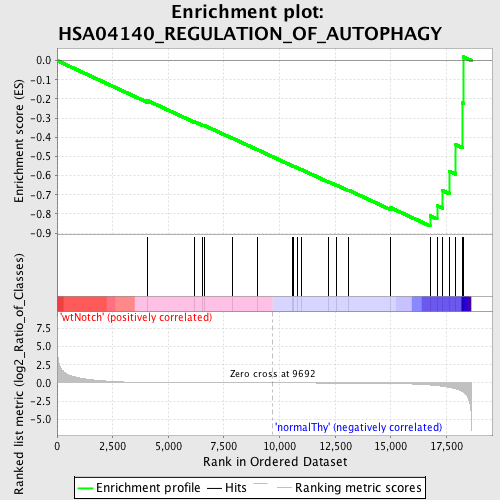
Profile of the Running ES Score & Positions of GeneSet Members on the Rank Ordered List
| Dataset | Set_03_wtNotch_versus_normalThy.phenotype_wtNotch_versus_normalThy.cls #wtNotch_versus_normalThy.phenotype_wtNotch_versus_normalThy.cls #wtNotch_versus_normalThy_repos |
| Phenotype | phenotype_wtNotch_versus_normalThy.cls#wtNotch_versus_normalThy_repos |
| Upregulated in class | normalThy |
| GeneSet | HSA04140_REGULATION_OF_AUTOPHAGY |
| Enrichment Score (ES) | -0.86267304 |
| Normalized Enrichment Score (NES) | -1.5966834 |
| Nominal p-value | 0.0021978023 |
| FDR q-value | 0.33265546 |
| FWER p-Value | 0.846 |
| PROBE | DESCRIPTION (from dataset) | GENE SYMBOL | GENE_TITLE | RANK IN GENE LIST | RANK METRIC SCORE | RUNNING ES | CORE ENRICHMENT | |
|---|---|---|---|---|---|---|---|---|
| 1 | ATG7 | 3940619 | 4078 | 0.051 | -0.2096 | No | ||
| 2 | IFNA7 | 2510239 | 6168 | 0.015 | -0.3190 | No | ||
| 3 | PIK3R4 | 1990132 | 6554 | 0.012 | -0.3374 | No | ||
| 4 | PRKAA1 | 510156 | 6608 | 0.012 | -0.3380 | No | ||
| 5 | ATG5 | 6200433 5360324 | 7900 | 0.006 | -0.4062 | No | ||
| 6 | IFNA14 | 4540142 | 9016 | 0.002 | -0.4658 | No | ||
| 7 | IFNA13 | 1980086 | 10559 | -0.003 | -0.5482 | No | ||
| 8 | IFNA2 | 4150162 | 10625 | -0.003 | -0.5512 | No | ||
| 9 | ATG3 | 5550647 6350050 | 10787 | -0.003 | -0.5592 | No | ||
| 10 | IFNA4 | 1940025 | 10979 | -0.004 | -0.5687 | No | ||
| 11 | IFNA1 | 5390592 | 12188 | -0.009 | -0.6320 | No | ||
| 12 | IFNA6 | 5550414 | 12561 | -0.011 | -0.6500 | No | ||
| 13 | IFNG | 5670592 | 13089 | -0.014 | -0.6756 | No | ||
| 14 | IFNA5 | 4780072 | 14993 | -0.054 | -0.7675 | No | ||
| 15 | ULK2 | 50041 5050176 | 16764 | -0.277 | -0.8095 | Yes | ||
| 16 | PIK3C3 | 6590717 | 17077 | -0.365 | -0.7563 | Yes | ||
| 17 | BECN1 | 3840433 | 17338 | -0.474 | -0.6793 | Yes | ||
| 18 | ULK1 | 6100315 | 17644 | -0.613 | -0.5780 | Yes | ||
| 19 | GABARAP | 1450286 | 17920 | -0.802 | -0.4390 | Yes | ||
| 20 | GABARAPL1 | 2810458 | 18235 | -1.223 | -0.2212 | Yes | ||
| 21 | ATG12 | 780167 | 18257 | -1.259 | 0.0193 | Yes |

